Crypto
SEI price prediction 2026-2032: Time to buy SEI?

Key takeaways:
- Our SEI price prediction anticipates a high of $0.14 by the end of 2026.
- In 2028, it will range between $0.09 and $0.19, with an average price of $0.12.
- In 2030, it will range between $0.12 and $0.41, with an average price of $0.29.
Our SEI price prediction sees SEI reaching as high as $0.14 by the end of 2026, potentially climbing to $0.52 by 2031 and into a $0.29-$0.56 range by 2032. For crypto investors, traders, and enthusiasts evaluating SEI’s upside and risk, that outlook matters because the project remains active on both the development and market fronts.
The Parallel Stack, a robust, open-source framework for building rollups and Layer 2s that leverage parallel processing, is now on SEI V2. The stack enhances Ethereum’s performance by addressing the most common bottlenecks Layer 2 blockchains face, and such developments could support SEI’s long-term value.
Regarding price performance, SEI shows signs of trading higher; however, it remains influenced by broader market sentiment. Below, we break down SEI’s current market position, technical analysis, price predictions from 2026 to 2032, recent developments, investment potential, and how this forecast compares with other expert outlooks so you can judge how high SEI could go and whether it fits your strategy.
Overview
| Cryptocurrency | Sei |
| Ticker | SEI |
| Current price | $0.04257 |
| Crypto market cap | $328M |
| Trading volume | $27M |
| Circulating supply | 7.69M |
| All-time high | $1.14 on Mar 16, 2024 |
| All-time low | $0.007989 on Aug 15, 2023 |
| 24-hour high | $0.04519 |
| 24-hour low | $0.04254 |
SEI price prediction: Technical analysis
| Metric | Value |
| Volatility (30-day variation) | 7.31% (High) |
| 50-day SMA | $1.02 |
| 200-day SMA | $0.8621 |
| Sentiment | Bearish |
| Green days | 14/30 (47%) |
| Fear and Greed Index | 28 (Fear) |
SEI price analysis
On November 9, SEI’s price fell 5.61% over 24 hours and approximately 37.02% over the last 30 days. Its 24-hour trading volume fell 47.80% to $34 million, signaling weak conviction in the market trend and a possible shift in momentum.
We use technical analysis of historical price action and chart patterns, and monitor technical resistance levels as reference points for potential price movement.
SEI 1-day chart analysis
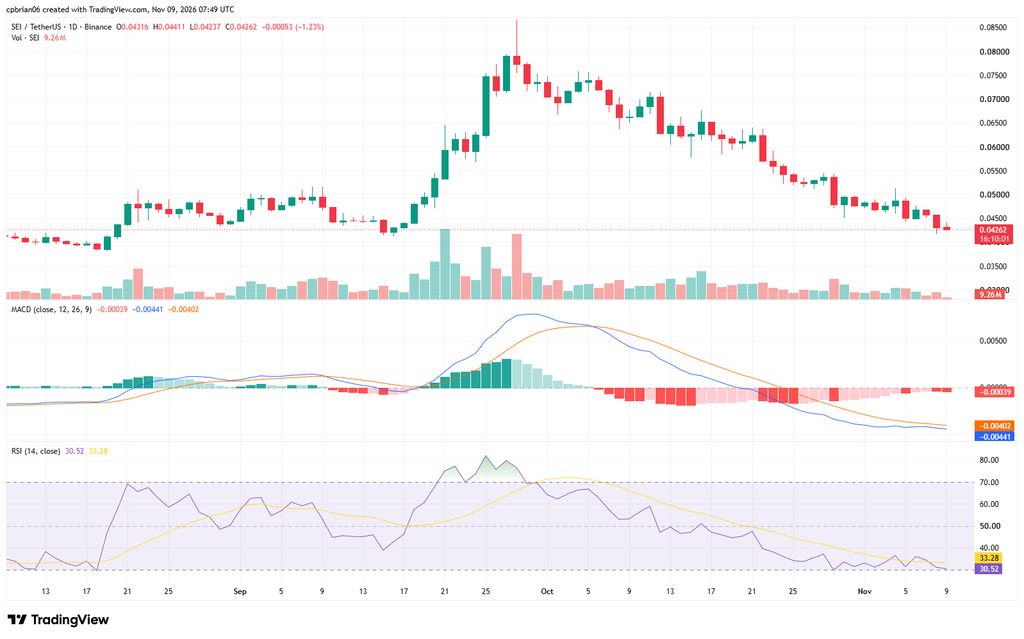
The 1-day chart’s price action shows SEI has broken below major moving averages after bouncing off the $0.08 peak. Its MACD histogram shows negative momentum, reflecting bearish pressure, though a crossover would signal a shift in momentum. The RSI is at 30.52, suggestive of a neutral market. It is oversold when the value drops below 30.
SEI price 4-hour chart analysis
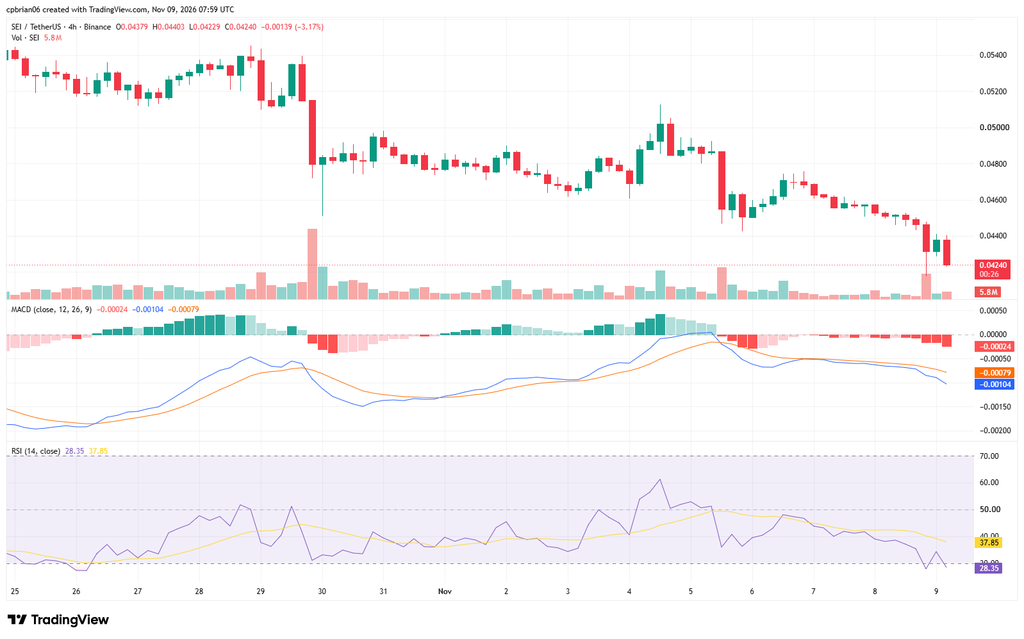
The 4-hour chart highlights SEI’s run this month. The trend is characterized by a bearish slant, reflecting a failure to reclaim near-term resistance on this timeframe. SEI’s momentum is negative in this timeframe, with the RSI at 28.35, and those resistance levels remain an important point for any short-term reversal attempt.
SEI technical indicators: Levels and action
Daily simple moving average (SMA)
| Period | Value ($) | Action |
| SMA 3 | 0.8602 | SELL |
| SMA 5 | 0.8828 | SELL |
| SMA 10 | 0.8889 | SELL |
| SMA 21 | 0.9304 | SELL |
| SMA 50 | 1.02 | SELL |
| SMA 100 | 0.8757 | SELL |
| SMA 200 | 0.8621 | SELL |
Daily exponential moving average (EMA)
| Period | Value ($) | Action |
| EMA 3 | 0.8689 | SELL |
| EMA 5 | 0.8764 | SELL |
| EMA 10 | 0.8927 | SELL |
| EMA 21 | 0.9269 | SELL |
| EMA 50 | 0.9452 | SELL |
| EMA 100 | 0.9160 | SELL |
| EMA 200 | 0.9829 | SELL |
Analysts also use a wide array of tools, including SMA, EMA, RSI, and MACD, to build SEI forecasts.
What to expect from the SEI price analysis next?
SEI is bearish, with short-term market conditions shaped by waning trading volumes and negative momentum; bearish pressure remains in place until price breaks above nearby resistance. Technical indicators now place key support levels at $0.040, with the 0.03-0.04 zone still important for near-term valuation. A move above resistance would shift focus toward the next recovery zone.
Why is SEI down?
The entire crypto market cap fell in the aftermath of the Binance exchange hack. The hack triggered a risk-off rotation away from speculative assets, and the broader sell-off also triggered profit-taking across altcoins, including SEI.
Will SEI reach $1?
According to the Cryptopolitan price prediction, SEI will rise above $1 in 2031, reaching a high of $1.37.
Can Sei Coin reach $10?
According to Cryptopolitan’s price prediction, SEI is unlikely to reach $10 before 2031. With a maximum token supply of 10 billion, SEI would need enormous market cap growth to support a $10 price. Its total supply is also a major valuation constraint when judging whether that target is realistic.
Will SEI reach $100?
According to Cryptopolitan’s price prediction, SEI is unlikely to reach $100 before 2031.
Does SEI have a good long-term future?
According to Cryptopolitan’s price predictions, SEI will trade higher in the years to come. Analysts track on-chain metrics to gauge the Sei network’s health and utilization, including TVL as a signal of utility and active decentralized application usage. They monitor both network activity and broader fundamental developments when building price predictions for users.
Improved scalability and developer tooling could attract more projects and liquidity to this layer 1, especially as Sei aims for 200,000 TPS, which would appeal to more developers. Technical upgrades, such as the Sei Giga upgrade, can also materially affect market sentiment; they aim to optimize Ethereum Virtual Machine execution and are expected to increase throughput by 50x.
SEI also faces competition from high-speed networks such as Solana and Aptos, while scheduled token unlock events can add circulating supply and create selling pressure if demand does not keep pace. Long-term projections also depend heavily on ecosystem growth and adoption.
Recent news
Ondo Finance has launched its flagship USDY fund on Sei Network, marking the first tokenized Treasury product on the layer-1 blockchain. The move strengthens ties between Ondo and World Liberty Financial, which holds ONDO tokens as its 12th-largest position. Sei’s RWA holders grew 24% in 30 days, reflecting increasing interest in the network. In the broader industry, 21Shares and Canary Capital filed for spot SEI ETFs in the U.S. Bitget also invested $50 million in Sei, signaling institutional backing.
Is SEI a good investment?
SEI is a high-performance Layer 1 platform for trading applications with growing utility, and its EVM compatibility helps it steal market share from Ethereum. While the technical analysis is bearish, price predictions paint a different picture. The outlook for this asset also depends on overall market sentiment, institutional crypto adoption, and macroeconomic trends.
Potential ETF developments could boost institutional interest in SEI, and broader institutional adoption can improve market dynamics by expanding access, especially since SEI’s infrastructure is designed for institutional-grade security and reliability. The network also uses Twin-Turbo consensus and has transaction finality of around 380 milliseconds, which can strengthen its utility case against Ethereum. Improved scalability and developer tooling, along with native frontrunning protection and multi-level transaction bundling, could bring more projects and liquidity to the network, while ongoing developer adoption could also drive short-term price surges.
Token vesting schedules can also create short-term sell pressure through supply dilution. Momentum also relies on fundamental growth metrics such as developer activity, TVL, user growth, ecosystem activity, and security, so investors should conduct thorough research before making investment decisions in this asset.
SEI price prediction November 2026
SEI’s current value suggests it will average at $0.07 in November. The price will range between $0.04 and $0.08.
| Month | Potential low ($) | Potential average ($) | Potential high ($) |
| November | $0.039 | $0.068 | $0.081 |
SEI price prediction 2026
This year, SEI will trade between $0.04 and $0.14, with an average of $0.09. Late-2026 projections still vary widely, and this SEI crypto price prediction also reflects short-term swings in the coming days and next week. The average price target for November 2026 is $0.0738. Some models place SEI in a 2026 trading channel between $0.05128 and $0.07323, with an end-of-2026 forecast near $0.05589. The broader 2026 outlook implies roughly -15% ROI for the year despite expected volatility.
| Year | Potential low ($) | Potential average ($) | Potential high ($) |
| 2026 | 0.0381 | 0.0858 | 0.1378 |
SEI price prediction 2027 – 2032
External forecasts also note potential upside in profit, including a 169.78% gain to $1,697.76 by July 16, 2027, and a 2030 target of $0.1495.
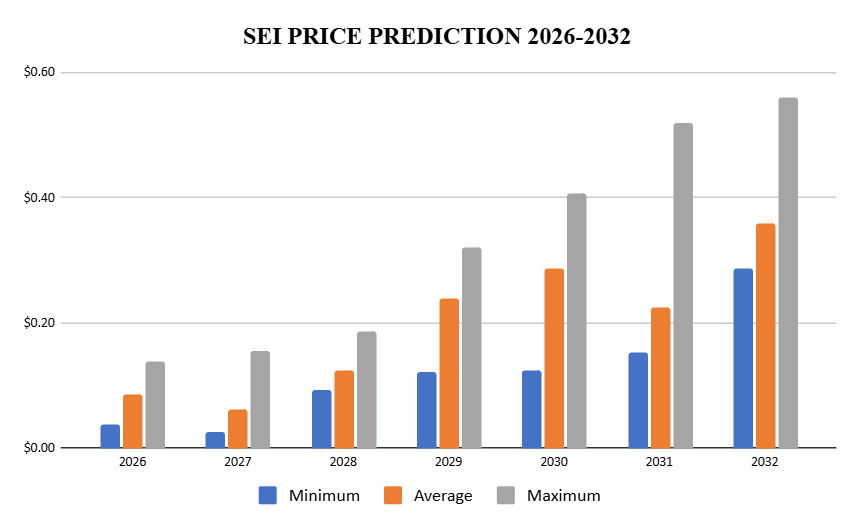
| Year | Potential low ($) | Potential average ($) | Potential high ($) |
| 2027 | 0.0259 | 0.0629 | 0.1546 |
| 2028 | 0.0939 | $0.1240 | $0.1861 |
| 2029 | 0.1212 | $0.2392 | $0.3199 |
| 2030 | 0.1249 | 0.2865 | $0.4054 |
| 2031 | 0.1521 | 0.224 | $0.5200 |
| 2032 | $0.2858 | $0.3587 | $0.5600 |
Cryptopolitan’s prediction 2027
The SEI forecast climbs higher into 2027. It will range between $0.0259 and $0.1546, with an average price of $0.0629.
SEI coin price prediction 2028
The analysis suggests a further acceleration in SEI’s growth in 2028. According to the Cryptopolitan price forecast, it will trade between $0.0939 and $0.1861, with a year-round average of $0.1240.
SEI token price prediction 2029
Based on SEI’s price movements in 2029, the maximum price is $0.3199, the minimum is $0.1212, and the average is $0.2392.
SEI price prediction 2030
The SEI coin price prediction for 2030 suggests a price range of $0.1249 to $0.4054 and an expected average trading price of $0.2865. Some longer-term projections put the minimum SEI prices and recovery range at about $0.82 to $1.26 by 2030.
SEI prediction 2031
SEI forecast for 2031 sets the high at $0.52. On the downside, it will drop to $0.15, with an average price of $0.22.
SEI price prediction 2032
According to expert predictions, the price of SEI will range from $0.29 to $0.56, with an average of $0.36.
Some post-2032 forecasts extend beyond this article’s horizon and suggest SEI could reach 4.00-8.00 by 2035.
SEI market price prediction: Analysts’ SEI price forecast
| Firm | 2026 | 2027 | 2028 |
| Gate.com | $0.045 | $0.054 | $0.062 |
| Coincodex | $0.035 | $0.058 | $0.066 |
Cryptopolitan SEI price prediction
SEI key price levels are expected to evolve over the coming years, according to price prediction tools. The coin will reach a high of $0.1378 before the end of 2026. In 2028, it will range between $0.09 and $0.19, with an average of $0.12.
SEI is highly volatile. Negative market sentiment, such as market crashes, could derail the predictions. Always seek independent professional consultation for investment advice. The information provided is for general informational purposes only and should not be treated as financial advice.
SEI historic price sentiment
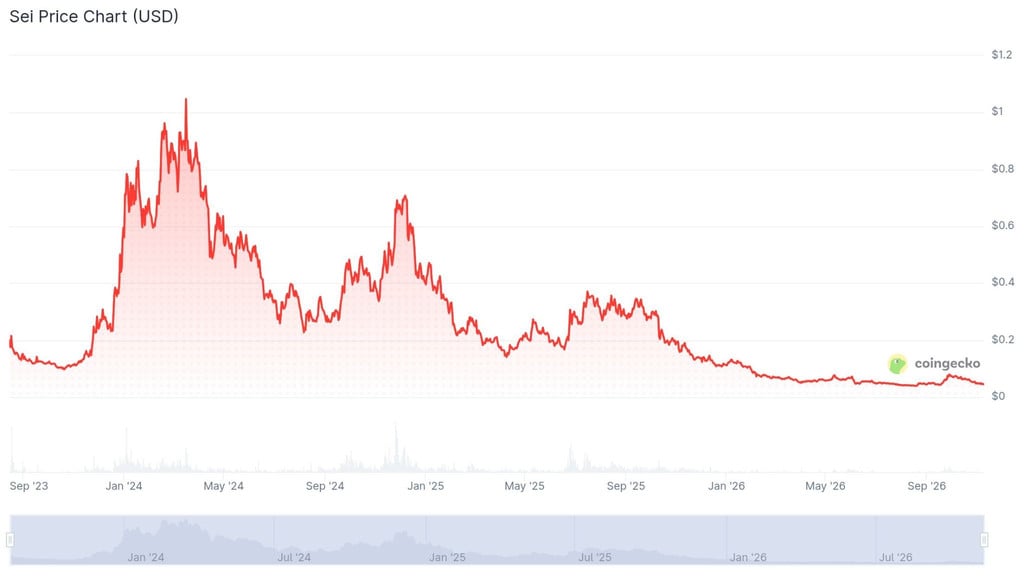
SEI price history. Image by CoinGecko
- SEI was established in 2022 and launched in August 2023 with the mainnet rollout, making SEI its native token following the public beta’s launch. A community airdrop accompanied the launch.
- The token also supports transaction fee payments.
- Sei was built as a layer 1 blockchain for decentralized finance applications in the broader crypto space, with a focus on exchange-oriented infrastructure.
- Decentralized exchanges are a core target use case, and the chain was designed to optimize trading on such platforms, including derivatives platforms and other trading applications.
- Sei emphasizes a secure, reliable, and robust infrastructure that provides a solid foundation for developers and users, while making scalability a core design goal across the platform.
- Carbon neutrality is also among Sei Network’s stated ecosystem goals.
- Governance decisions can involve token holders through the network’s community processes.
- SEI news and broader ecosystem developments can also influence sentiment around the token over time as SEI expands its DeFi ecosystem.
- As per CoinMarketCap data, it started trading at $0.1808.
- Since listing, it has experienced significant fluctuations, reaching an all-time low of $0.007989 on August 15, 2023.
- The coin later reached an all-time high of $1.14 on March 16, 2024.
- Since March, it has been in a bear market, falling to $0.27 in September. It then began to recover, trading at $0.45 in October, a time when long-term holders may accumulate if bullish sentiment improves.
- It then began to recover in November; by December, it had risen above $0.68.
- It was later corrected and crossed into 2025, trading at $0.40, dropping to $0.32 in February. By March, it had fallen below $0.27, reflecting historical patterns in crypto where profit-taking often drives a correction before recovery.
- In June, it fell below $0.20. In December, it reached $0.13.
- External crypto correlations, including narratives around the artificial superintelligence alliance and other cryptocurrencies such as Immutable X and Bitcoin, can also affect broader risk appetite and Sei price movements.
- Rapid changes in market capitalization have also contributed to sharp price swings in Sei over time, as with many crypto coins.
- In February 2026, it fell below the $0.10 support level. By April and May, it had fallen below the $0.06 support level. Between June and September, it traded at $0.05.
- In the third week of September, it broke higher, and by October, it had reached $0.07. It later reversed to $0.40 in November.

The content on CoinReporter.io is for informational purposes only and is not financial or investment advice. Cryptocurrency investments are highly volatile and risky. Always conduct your own research and consult a qualified financial advisor before making any investment decisions. CoinReporter.io and its authors are not liable for any losses resulting from actions based on this website’s content.
Key takeaways:
- Binance coin price prediction for 2026 indicates that the coin’s price could reach a maximum price of $1,161.
- The Binance coin price prediction for 2028 projects a maximum price of $1,960 and a minimum price of $1,693.
- By 2032, BNB’s price could surge to $4,141 with broader acceptance in mainstream finance.
After notable changes in its executive team, Binance has shown resilience and prospects for recovery. The departure of Changpeng Zhao, Binance’s CEO, who was also embroiled in legal challenges, initially caused a decline in the value of Binance coin (BNB). Despite this initial setback, the cryptocurrency has shown a positive trend. In September 2020, Binance introduced BNB Smart Chain, which was initially designed for trading and transferring tokens and runs parallel to Binance Chain and supports smart contracts and decentralized applications (dApps) within the BNB Chain ecosystem.
What’s next for BNB in the remainder of 2026 and beyond? What can be the future price movements? Let’s get into the BNB price prediction and technical analysis.
Overview
| Cryptocurrency | Binance coin |
| Token | BNB |
| Price | $679.78 (-2.5%) |
| Market Cap | $89.57B |
| Trading Volume (24-hour) | $1.49B |
| Circulating Supply | 131.51M BNB |
| All-time High | $1,369.99 Oct 13, 2025 |
| All-time Low | $0.09611, Aug 01, 2017 |
| 24-hour High | $699.23 |
| 24-hour Low | $672.97 |
Binance coin price prediction: Technical analysis
| Metric | Value |
| Price Prediction | $784.72 (9.07%) |
| Fear & Greed Index | 34 (Fear) |
| Market Sentiment | Neutral |
| Volatility | 2.92% |
| Green Days | 16/30 (53%) |
| 50-Day SMA | $747.49 |
| 200-Day SMA | $655.82 |
Binance coin price analysis
TL;DR Breakdown:
- BNB price analysis shows a bearish trend, with the price trending at $679.78.
- The altcoin lost 2.5% in its value over the past 24 hours.
- BNB faces resistance around $695.
As of November 9, 2026, Binance Coin is exhibiting a bearish trend as sellers attempt to build traction. Price analysis reveals that the altcoin is again correcting after experiencing a price correction yesterday, facing the nearest resistance around $694. BNB is currently trading at $679.78, down 2.5% over the last 24 hours. Today’s losses could widen as selling pressure mounts, with 24-hour trading volume at $1,49B and total supply at 133.51M BNB.
BNB/USD price analysis on the daily timeframe
The one-day chart for Binance Coin (BNB) shows that selling pressure is emerging again following yesterday’s depreciation. Sellers may retest the $667 support again in the next few hours, with the price now hovering around the $679.78 mark. The recent correction is relatively robust, which is evident from the latest significant decrease in price. The emergence of a new red candlestick on the chart clearly signifies the presence of bearish elements as sellers suppress the price levels.
The distance between the Bollinger Bands highlights the intensity of volatility. This distance is still wide, leading to high volatility. Moreover, the upper limit of the Bollinger Bands indicator, indicating resistance, has shifted to $762. On the other hand, its lower limit indicates support, moving around $667.
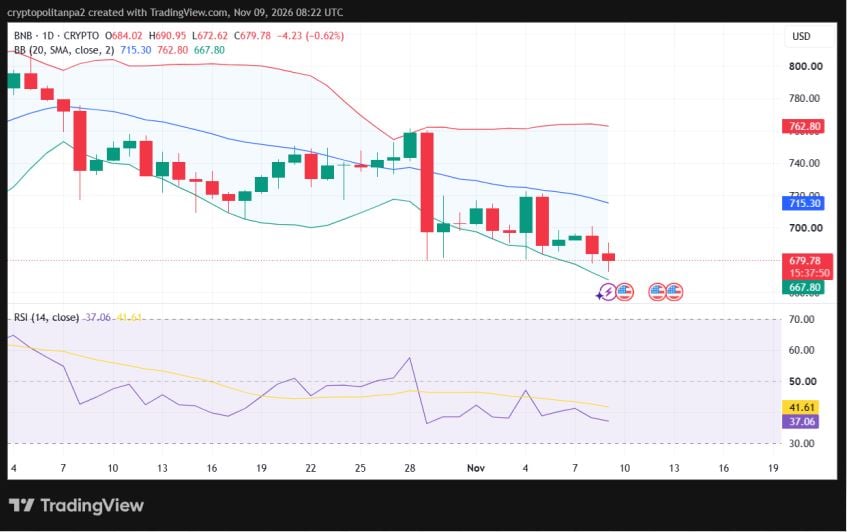
The Relative Strength Index (RSI) indicator is trending in the neutral region as it moves downwards. The indicator’s value has decreased to 37 in the past 24 hours. This situation indicates a negative market sentiment for BNB at the time of writing, as the bearish sentiment still exists at the current price level.
BNB price analysis on a 4-hour chart
The hourly candlestick charts analysis of Binance Coin shows slightly positive sentiment for the altcoin. The BNB/USD pair recovered to $680.09 over the past few hours. The price is still trending below its simple moving average value.
The Bollinger Bands are covering more area, reflecting high market volatility. The high volatility signifies a higher chance of an upcoming reversal or further price increase. Moving ahead, the upper Bollinger Band has shifted to $704, indicating resistance. Conversely, the lower Bollinger Band has moved to $680, marking a support level.
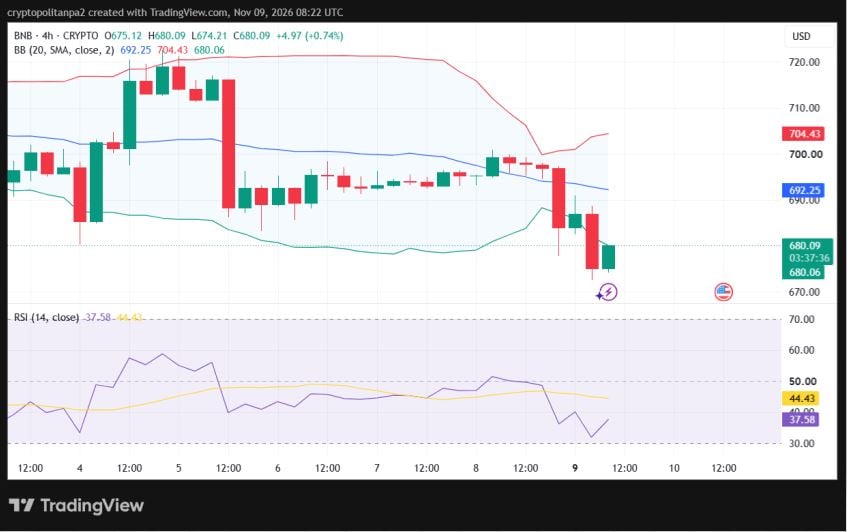
Multiple technical quantitative indicators are neutral but the RSI (Relative Strength Index) is trending in the neutral range. The indicator’s value increased to 37 over the past few hours as the price moved upwards. The indicator’s ascending curve suggests the presence of support from the buying side of the market, which is an encouraging sign for long-position holders.
BNB technical indicators: Levels and action
Daily simple moving average (SMA)
| Period | Value ($) | Action |
| SMA 3 | 692.17 | SELL |
| SMA 5 | 699.13 | SELL |
| SMA 10 | 701.05 | SELL |
| SMA 21 | 720.91 | SELL |
| SMA 50 | 744.67 | SELL |
| SMA 100 | 706.37 | SELL |
| SMA 200 | 657.26 | BUY |
Daily exponential moving average (EMA)
| Period | Value ($) | Action |
| EMA 3 | 695.82 | SELL |
| EMA 5 | 698.23 | SELL |
| EMA 10 | 705.02 | SELL |
| EMA 21 | 716.62 | SELL |
| EMA 50 | 723.79 | SELL |
| EMA 100 | 706.86 | SELL |
| EMA 200 | 703.03 | SELL |
What to expect from Binance coin price analysis?
Binance Coin candlestick charts analyses give a bearish prediction, as the current market sentiment is turning to be negative again following a previous depreciation. At a price of $679.78, BNB now floats significantly below its highest price range of the month, with a further correction in price over the past few hours. If traders continue to sell, the BNB price may see a further decrease and break below $667.
On the other hand, a success in attracting buying demand might result in a recovery. In such a case, the price of BNB might head toward the immediate resistance at $723.
Is BNB a good investment?
Considering the recent price moves, purchasing Binance coins and holding them for an extended period could yield significant returns. From a five-year plan standpoint, it is projected to see a large increase, possibly rising above $4,141 in 2032. However, financial choices shouldn’t be made exclusively based on our data.
Why is BNB down?
BNB found resistance at $723, and the price moved toward $679.78, as bears are now targeting $667 once again. The cryptocurrency now reports a 2.5% loss for the past 24 hours. If looked at from an overall view, the coin is now correcting again after losing some value at the time of writing.
Will BNB reach $1000?
The BNB price has already crossed $1000 in 2025, and buyers are holding it above $700. BNB can cross the $1000 again in 2026 anytime.
Will BNB reach $2000?
Currently, BNB is feeling pressure from legal challenges around its ecosystem. However, as these issues are settled by next year and on chain activity increases, the coin’s price is expected to start a bull run. As per the Binance coin price prediction, BNB will reach $2000 by the start of 2029.
Will BNB reach $4000?
Binance allows users to save up to 25% on spot margin trading fees by using BNB. Another factor is that users can save up to 10% on futures trading expenditures with the token, which makes the Binance platform a primary choice. Binance also uses a significant portion of its earnings to buy back BNB, which supports the Binance ecosystem. The burning process also decreases the token supply and increases demand, which is expected to increase in value above $4,141 by the end of 2032, which makes it a good option to buy BNB.
Does BNB have a good long-term future?
All cryptocurrencies involve risks and uncertainties. However, looking at the past price performance and the fact that BNB has a strong market position and a management team that runs the world’s largest cryptocurrency exchange. BNB has the potential for increased utility and is expected to retain a strong position in the cryptocurrency sphere. Binance coin price prediction and some fundamental factors suggest that holding it for the long haul is a good option, with tenfold expected returns in five years and the price reaching $4,141 by 2032. However, one must conduct his/her own research or seek professional financial advice before making investment decisions for digital assets.
Recent news/opinions on BNB
- Cryptopolitan reported that Binance has been hit by a hack it now estimates at around $6.3 billion following the October 29 exploit, marking the largest breach in crypto history. A compromised DevOps engineer’s laptop may have given the attacker initial access to issue unauthorized withdrawals, according to Binance’s first findings.
BNB price predictions for November 2026
According to expert analysis, Binance coin could reach a maximum price of $1,067 in November 2026. The average trading price is expected to be $760 for the month. The lowest BNB can go is $596, as per the current forecast.
| Period | Potential Low | Potential Average | Potential High |
| Binance coin price prediction November 2026 | $596 | $760 | $1,067 |
BNB price prediction 2026
According to the BNB forecast for 2026, it might reach a minimum price of $560. The maximum price can reach $1,161, with an average trading price of about $663.
| Period | Potential Low | Potential Average | Potential High |
| 2026 | $560 | $730 | $1,161 |
BNB price predictions 2027 – 2032
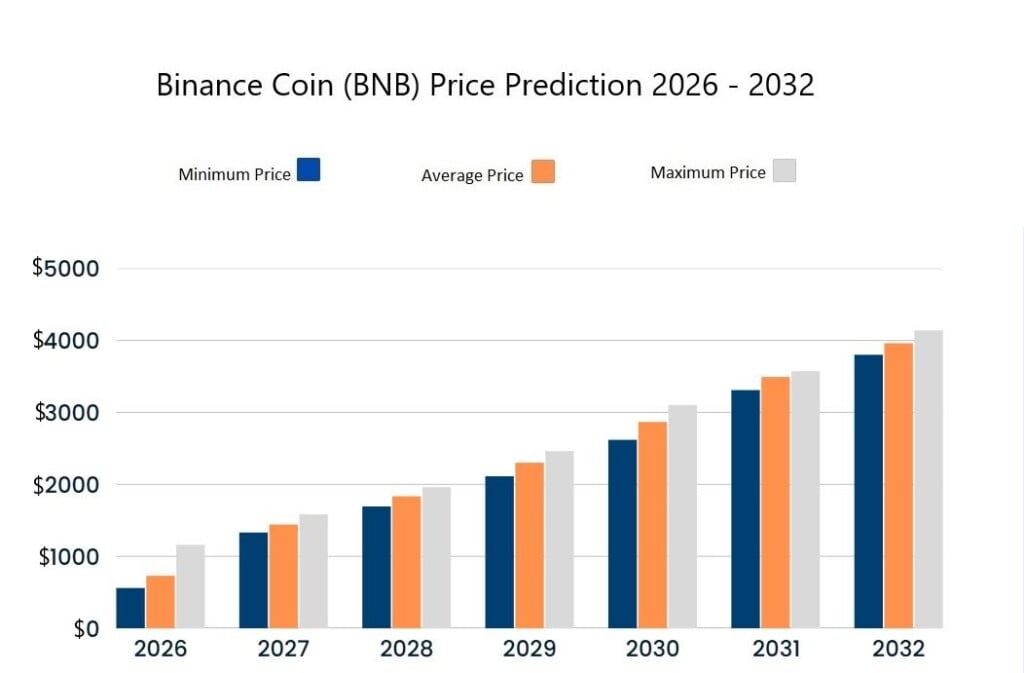
| Year | Minimum Price | Average Price | Maximum Price |
| 2027 | $1,331 | $1,442 | $1,584 |
| 2028 | $1,693 | $1,835 | $1,960 |
| 2029 | $2,113 | $2,301 | $2,463 |
| 2030 | $2,619 | $2,868 | $3,104 |
| 2031 | $3,310 | $3,493 | $3,573 |
| 2032 | $3,801 | $3,961 | $4,141 |
Binance coin price prediction 2027
Driven by strong technical factors, BNB could reach a maximum price of $1,584 in 2027, with an average of $1,442 and a minimum of $1,331.
Binance coin price prediction 2028
For 2028, the Binance Coin price forecast suggests that BNB could achieve a maximum valuation of $1,960, with an average trading price of $1,835 and a minimum of $1,693.
Binance coin price prediction 2029
In 2029, BNB is projected to have a maximum price of $2,463, an average price of $2,301, and a minimum value of $2,113.
Binance coin price prediction 2030
By 2030, BNB could reach a maximum predicted price of $3,104, with an average trading price of $2,868 and a minimum of $2,619.
Binance coin price prediction 2031
As per the Binance coin forecast, in 2031, BNB may attain a maximum valuation of $3,573, with an average closing price of $3,493 and a minimum of $3,310.
Binance coin price prediction 2032
The price of Binance Coin (BNB) could reach a maximum price of $4,141 in 2032, with an average value of $3,961 and a minimum of $3,801.
BNB market price prediction: Analysts’ BNB price forecast
| Firm Name | 2026 | 2027 |
| DigitalCoinPrice | $905.67 | $1,126.94 |
| CoinCodex | $933.55 | $2,144.97 |
Cryptopolitan’s BNB price prediction
Our forecast shows that Binance coin will achieve a high price of $1,161 by the end of 2026. In 2027, BNB’s price will range between $1,331 and $1,584. In 2032, it will range between $3,801 and $4,141, with an average of $3,961.
It is important to consider that the predictions are not investment advice. Professional consultation is suggested before investing in the volatile crypto market.
Binance Coin historic price sentiment
- Binance’s native token, BNB was launched in July 2017 through an Initial Coin Offering (ICO), with an initial price of around $0.10, according to historical crypto market data. As a utility token for the Binance cryptocurrency exchange started trading; it offered users reduced trading fees.
- In late 2017, BNB’s price significantly increased and reached its first major peak in January 2018, hitting approximately $24. However, it experienced a decline following the broader market correction.
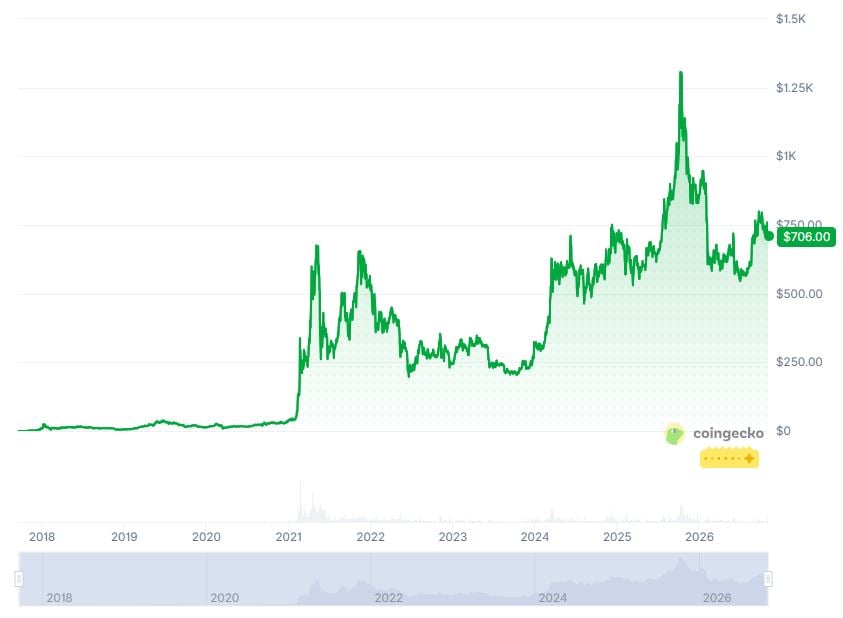
- Throughout 2018 and 2019, BNB’s price experienced gradual growth as the BNB market soared. In 2018, BNB traded near $13 for most of the year but dropped to $5 by December. However, BNB reached above $30 in June 2019, with broader growth in the crypto and stock market.
- Despite the global economic uncertainty caused by the COVID-19 pandemic, BNB maintained relative stability and saw an upward trend in 2020. Due to the growing popularity of Binance as an exchange and the expansion of its ecosystem, the coin touched the $34 range in November 2020.
- BNB experienced a significant bull run in early 2021, reaching a high of $600 in May 2021. Positive market sentiment helped improve its market capitalization, which remained at an all-time high until recently.
- Binance Coin’s price dynamics in 2022 were characterized by volatility and were influenced by a combination of macroeconomic factors and regulatory developments around the Binance exchange, which led to a bearish scenario. This took BNB to less than $220 in June and an average price of $250 in December.
- BNB remained a significant player in the cryptocurrency market in 2023, recovering to about $350 in April. However, it soon lost momentum, reaching about $205 in October. In late December, BNB climbed back to about $325.
- At the beginning of 2024, Binance Coin (BNB) traded near $300, surged to an all-time high of $717.48 in June, fluctuated between $488 and $661 through the year, and closed December at $700.3.
- In January 2025, BNB maintained an average price of $697, but it decreased to $589 by the end of February.
- BNB traded near the psychological mark of $600 in March and April 2025, and it reached above $650 in May, while it marked a new ATH of $858.34 on July 28.
- In August, BNB broke its own record and discovered several new all-time highs when BNB increased to $899.77 on August 22, showing significant growth.
- On September 21, BNB reached the $1,079.07 mark. In October, it hit a new all-time high (ATH) of $1,369.99 and is trading near the $1,100 mark in November.
- By the end of November, the price of BNB declined below $800. In early December, BNB price triggered a strong bull run toward $900.
- At the start of 2026, BNB was trending near the $870 level. However, it later declined toward
$620 in early March. - In April, the BNB price broke above $600, and it continued to hold steady above that level in May with some degree of bullish price action. However, BNB turned bearish in June, when the crypto market succumbed to heavy corrections.
- A steady bullish trajectory was sustained through August and September as BNB broke above $800. Following recent pullbacks, the token is currently consolidating near $706 as November begins.
Don’t just read crypto news. Understand it. Subscribe to our newsletter. It’s free.


Bitcoin Slips Toward $74,600
Bitcoin traded in a tight range near $75,000–$76,000 for much of November 8 before settling lower, closing the CoinMarketCap snapshot...


Bitcoin Crashes Toward $75K
Bitcoin closed November 6 near $75,900 after an intense sell-off that pushed it as low as roughly $74,800 intraday—its weakest...


Crypto Market Stabilizes After Sharp Dip
Bitcoin recovered from multi-week lows near $75,200 and stabilized above $76,000 on November 6, 2026, as the market absorbed a...


Elizabeth Warren Expected to Chair Senate Banking Committee After Democratic Midterm Sweep
Longtime crypto critic Senator Elizabeth Warren is positioned to lead the powerful Senate Banking Committee when the new Congress convenes...


Bitcoin Dips to Multi-Week Lows Near $75,200 Before Recovering Above $76,000
Bitcoin briefly tumbled below $76,000 on November 6, 2026, reaching multi-week lows near $75,200 before buyers stepped in and the...


Bitcoin Rebounds Past $80,000 as Midterms Conclude and Markets Digest Binance Hack Details
Bitcoin staged a sharp V-shaped recovery on November 4, reclaiming $80,000 after briefly touching a seven-week low near $75,600–$75,700. The...


Bitcoin Volatility and ETF Outflows Amid Elections and Hack Fallout
Bitcoin experienced sharp swings in early November, dipping below $76,000 to multi-week lows near $75,700 as residual fallout from the...


Binance SAFU Fund Falls Below $800 Million Threshold After Record Hack Coverage
Binance has drawn down roughly half of its Secure Asset Fund for Users (SAFU), leaving the Bitcoin reserve near 7,500...


Bitcoin Falls Below $77,000 as Chip Stocks Sell Off Ahead of U.S. Midterms
Bitcoin traded under $77,000 on November 3, 2026, down roughly 2% over 24 hours, as a deepening sell-off in semiconductor...


U.S. Spot Bitcoin ETFs See Multi-Hundred-Million Outflows as Post-Hack Caution Weighs
U.S. spot Bitcoin ETFs recorded substantial net outflows in the sessions surrounding the Binance security incident, with redemptions totaling roughly...
-

 Crypto1 month ago
ESMA gives EU crypto firms three months to exit non-MiCA stablecoins
-

 Bitcoin4 weeks ago
Strategy (MicroStrategy) Adds 250 Bitcoin, Holdings Reach 848,250 BTC
-

 DeFi4 weeks ago
Bitcoin Drops Below $82,000 Amid $770M+ in Liquidations as Volatility Spikes
-

 DeFi1 month ago
Government-linked wallets move seized coins
-

 Bitcoin1 month ago
Spot bitcoin ETFs flip to a ~$487 million outflow
-

 Bitcoin1 month ago
Bitcoin loses $84,000 as Hormuz attacks lift oil and yields
-

 DeFi1 month ago
Winklevoss files a 0.25% Zcash ETF
-

 DeFi4 weeks ago
U.S. Spot Bitcoin and Ethereum ETFs See Significant Weekly Outflows
-
DeFi4 weeks ago
Bitcoin Holds Above $84,000, Shrugging Off Heavy ETF Outflows as Oil Declines
-

 DeFi1 month ago
Uptober stalls ahead of the Fed minutes
-
 DeFi4 weeks ago
TRON Q3 2026 Report: $2.21 Trillion in Stablecoin Settlement Volume
-

 Crypto1 month ago
Ether funds were already bleeding
-

 DeFi3 weeks ago
Arbitrum Rallies on Stablecoin Growth Program as DeFi Tokens Outperform
-

 DeFi2 weeks ago
LUNC Hits 462B Burned After v4.1.1 Upgrade
-
 DeFi3 weeks ago
Bitcoin and Ethereum Spot ETFs Record Substantial Weekly Outflows
-

 DeFi3 weeks ago
BNB Standard Corporation
-

 DeFi3 weeks ago
Nine Crypto Firms Launch Quantum Alliance to Set Post-Quantum Standards
-

 DeFi4 weeks ago
South Korea Blocks Domestic Access to 27 Unregistered Crypto Exchange Websites, Including KuCoin and MEXC
-
 DeFi3 weeks ago
Swiss FINMA Approves First Retail Bitcoin ETF Holding BTC Directly
-

 DeFi3 weeks ago
U.S. Spot Bitcoin ETFs Post Best Inflow Day in Nearly a Month
-

 DeFi2 weeks ago
Binance-Linked Transfer Triggers 347 Million LUNC Burn
-

 DeFi3 weeks ago
Strive Discloses Additional Bitcoin Purchases, Holdings Reach 36,818 BTC
-

 DeFi3 weeks ago
Inflation Shock Triggers Nearly $1 Billion in Liquidations as Bitcoin Tests $80,000
-

 DeFi3 weeks ago
World Liberty Financial’s USD1 Stablecoin Sheds Over $400 Million in Market Cap Amid Redemptions
-

 DeFi4 weeks ago
Ethereum Foundation-Linked Wallets Transfer 4,393 ETH (~$11 Million) to Kraken
-

 DeFi4 weeks ago
Binance Rolls Out AI Trading Interface Globally After 150,000-User Beta
-

 DeFi3 weeks ago
Crypto Hacks and Losses Reach $1.18 Billion in Q3 2026 Across 107 Incidents
-

 DeFi2 weeks ago
Crypto Liquidations Surge Past $400 Million in Hours as Bitcoin Briefly Dips Below $80,000
-

 Crypto2 weeks ago
DTCC Launches Tokenization Service Covering Approximately $30 Trillion in Securities
-

 DeFi4 weeks ago
Bitcoin Drops Below $81,000 as Hotter U.S. CPI Revives Rate-Hike Fears and Asian Equities Tumble
-

 Crypto2 weeks ago
Memecoin PEPE Rallies on Reported Large Holdings Linked to Justin Sun; Broader Tokenization Debate Continues
-

 DeFi2 weeks ago
Ripple Secures Final OCC Approval for National Trust Bank to Oversee RLUSD
-
 DeFi2 weeks ago
Bitcoin Slides Below $81,500 as Tech Sell-Off and Elevated Oil Prices Hit Risk Assets
-

 Bitcoin2 weeks ago
Federal Reserve Holds Rates Steady as Bitcoin Trades Near $80,000; December Hike Odds Rise
-

 DeFi3 weeks ago
Mt. Gox Extends Creditor Repayment Deadline to October 2027
-

 DeFi3 weeks ago
Strive Adds $335 Million in Bitcoin to Corporate Treasury