Crypto
Dogwifhat price prediction 2026 – 2032: Can WIF recover to $1?

Key takeaways:
- Dogwifhat’s price prediction for 2026 suggests a maximum price of $0.70.
- WIF could reach a maximum price of $2.00 by the end of 2029.
- By 2032, WIF’s price may surge to $4.50.
Remember Dogecoin and Shiba Inu? The popular dog-themed memecoins!
Dogwifhat (WIF) is another dog-inspired memecoin built on the Solana blockchain. Despite being relatively new on the market (launched in November 2023), the “dog wif a hat” project saw remarkable success post-launch.
Following the exchange listing of the token on Binance and the popular “Sphere Wif Hat” campaign that led to the crowdfunding of over 690,000 USDC, the value of WIF surged, temporarily usurping PEPE coin in late March 2024 to rank as the 3rd largest memecoin behind Dogecoin (DOGE) and Shiba Inu (SHIB).
Having no utility, the success of Dogwifhat (WIF) has birthed other spinoffs, Catwifhat, Simbawifhat, Wenwifhat, and Bonkwifhat, with more hat-wearing dog memecoins hitting the market afterwards. Dogwifhat has thus far recorded significant feats in terms of valuation and exchange listing.
The token approached the $5 mark on March 31, 2024 ($4.58B market cap), saw massive price movements after the November U.S. elections, and got listed on Binance US, Coinbase, KuCoin, Robinhood, and more.
However, a massive bear market ensued, and WIF lost momentum. Leaving investors asking: How high can dogwifhat crypto go?
Let’s explore the current market sentiments and the possibilities of WIF reaching new all-time highs (ATHs).
Overview
| Cryptocurrency | Dogwifhat |
| Ticker | WIF |
| Current price | $0.1798 |
| Market cap | $179.511M |
| Trading volume | $35.859M |
| Circulating supply | 998.926M WIF |
| All-time high | $4.85 on (March 31, 2024) |
| All-time low | $0.001555 (December 2023) |
| 24-hour high | $0.1818 |
| 24-hour low | $0.1752 |
Dogwifhat price prediction: Technical analysis
| Metric | Value |
| Volatility (30-day Variation) | 9.62% (High) |
| 50-day SMA | $0.2172 |
| 14-Day RSI | 39.69 (Neutral) |
| Sentiment | Bearish |
| Fear & Greed Index | 63 (Greed) |
| Green days | 16/30 (53%) |
| 200-Day SMA | $0.1844 |
Dogwifhat (WIF) price analysis
TL;DR Breakdown
- WIF’s daily trend remains bearish below $0.1923, although the shrinking negative MACD histogram suggests selling momentum is easing.
- The four-hour rebound is struggling beneath $0.1762–$0.1778, with RSI at 45.91 showing buyers have yet to regain a momentum advantage.
- Immediate support sits around $0.1740–$0.1750, while a break below could expose $0.1700–$0.1675; resistance remains at $0.1800–$0.1830.
Dogwifhat price analysis 1-day chart
As of October 31, 2026, WIF is trading near $0.1754 after rebounding from a sharp sell-off toward $0.1560. The token remains below the declining Bollinger middle band at $0.1923, leaving the daily downtrend intact.
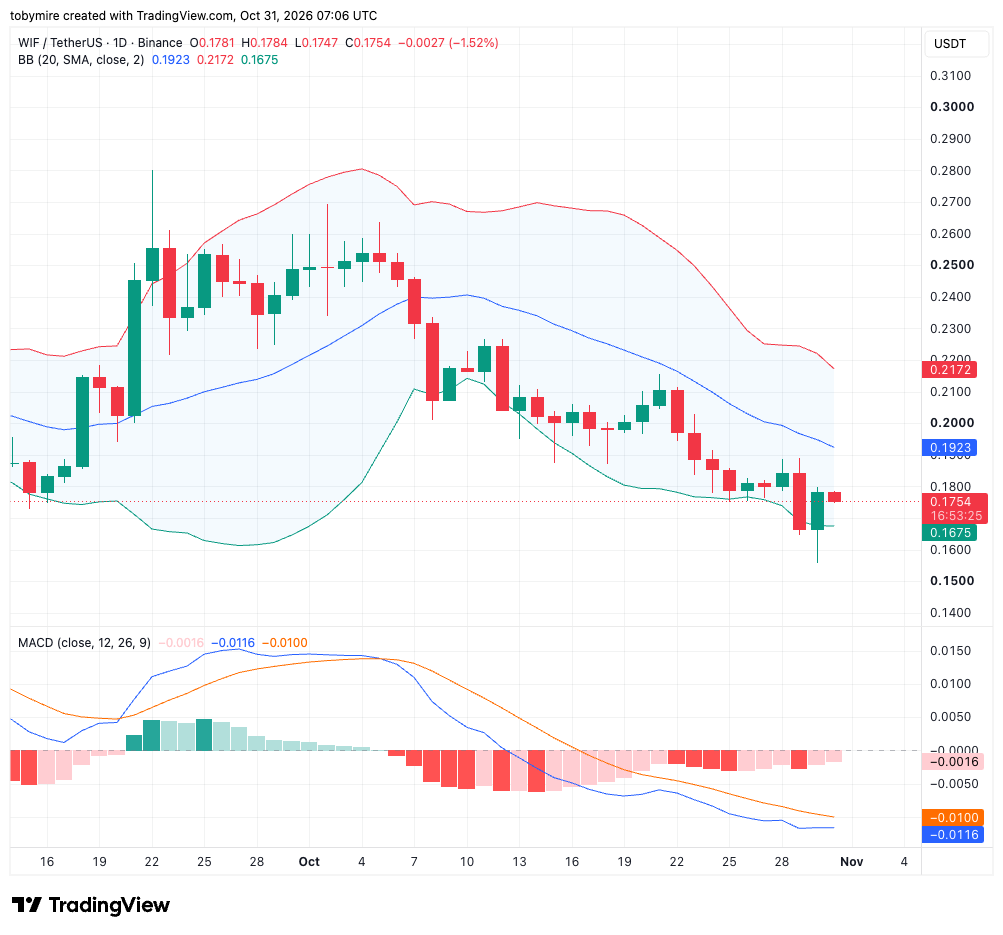
The MACD stands at -0.0116, below its signal line at -0.0100, although the shrinking negative histogram suggests selling momentum is easing.
Initial support lies around $0.1675–$0.1650, followed by the recent low near $0.1560. Resistance sits around $0.1800–$0.1880, ahead of $0.1923.
Dogwifhat price analysis 4-hour chart
WIF is trading around $0.1756 as its rebound slows near the Alligator lines. The token is barely above the green line at $0.1755 but remains below the red and blue lines at $0.1762 and $0.1778, showing that buyers have yet to establish control.
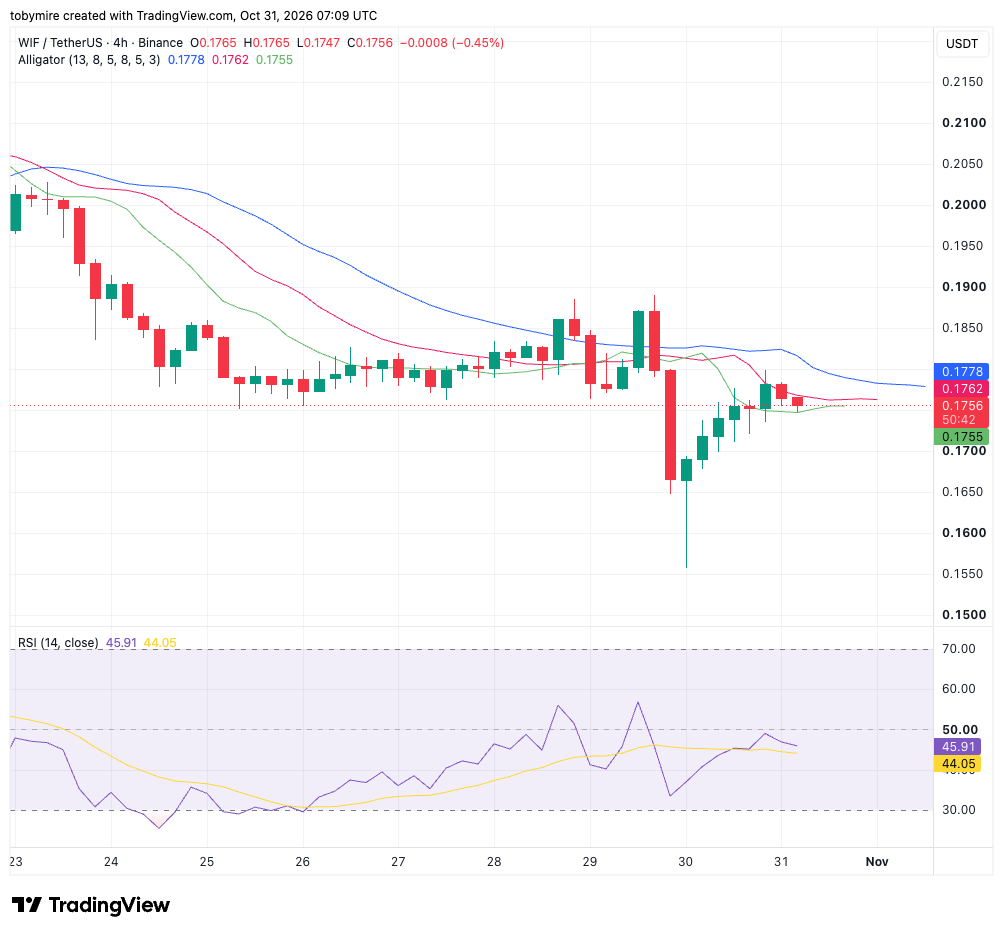
The RSI stands at 45.91, above its average of 44.05 but below 50, indicating improved momentum that still falls short of a bullish reading.
Immediate support lies around $0.1740–$0.1750, followed by $0.1700 and $0.1650. A sustained move above $0.1778 would strengthen another attempt at $0.1800–$0.1830.
Dogwifhat technical indicators: Levels and action
Daily simple moving average (SMA)
| Period | Value | Action |
|---|---|---|
| SMA 3 | $ 0.2035 | SELL |
| SMA 5 | $ 0.2079 | SELL |
| SMA 10 | $ 0.2159 | SELL |
| SMA 21 | $ 0.2324 | SELL |
| SMA 50 | $ 0.2172 | SELL |
| SMA 100 | $ 0.1849 | BUY |
| SMA 200 | $ 0.1844 | BUY |
Daily exponential moving average (EMA)
| Period | Value | Action |
|---|---|---|
| EMA 3 | $ 0.2034 | SELL |
| EMA 5 | $ 0.2069 | SELL |
| EMA 10 | $ 0.2149 | SELL |
| EMA 21 | $ 0.2214 | SELL |
| EMA 50 | $ 0.2134 | SELL |
| EMA 100 | $ 0.2007 | BUY |
| EMA 200 | $ 0.2216 | SELL |
What to expect from WIF price analysis?
WIF’s rebound has eased selling pressure, but both timeframes still show a weak recovery within a broader downtrend.
Holding $0.1740–$0.1750 could support another test of $0.1778–$0.1830, while losing that area could bring $0.1700–$0.1675 back into focus. The daily outlook would improve with a sustained recovery above $0.1923.
Is Dogwifhat crypto a good investment?
Dogwifhat (WIF) is a highly speculative meme coin fueled by online culture and community enthusiasm rather than fundamental utility or innovation. While it may present short-term opportunities for high-risk traders during bullish market sentiment, its long-term investment value remains questionable.
With no clear roadmap, technical use case, or underlying utility, WIF’s price is largely driven by social media trends and investor speculation. For cautious or long-term investors, it poses significant risk and should only be considered in minimal portfolio allocations. Ultimately, dogwifhat is better suited for speculative play than strategic, utility-based crypto investing grounded in strong fundamentals.
Where to buy WIF?
Currently, traders and investors can buy Dogwifhat (WIF) on these CEXs: Binance, Binance.US, Raydium, Coinbase Exchange, Gate.io, KuCoin, Kraken, Crypto.com Exchange, MEXC, HTX, Bybit, Bitget, LBank, and several others.
Will WIF reach $10?
Having reached a peak price of $4.85 in 2024, the $10 target might not be too far-fetched.
Can Dogwifhat reach $100?
Dogwifhat reaching $100 is highly ambitious and unlikely. With a circulating supply of about 998.83 million WIF, a $100 price would imply a market cap of roughly $99.9 billion, which would exceed Dogecoin’s widely cited peak market cap of about $88.79 billion in 2021.

Does WIF have a good long-term future?
WIF has the potential for a good long-term future if it continues to gain popularity and adoption. Analysts project a market price of approximately $0.5 by the end of 2026 and between $2 and $3 by 2032. However, as with all meme coins, WIF’s future is uncertain and highly dependent on market trends and community support.
Dogwifhat price prediction October 2026
If the bulls back WIF, the token could reach as high as $0.28 in October. Traders can expect an average trading price of $0.21 and a minimum price of $0.13.
| Dogwifhat price prediction | Potential Low ($) | Average Price ($) | Potential High ($) |
| WIF price prediction October 2026 | 0.13 | 0.21 | 0.28 |
Dogwifhat price prediction 2026
Impactful updates and community support in 2026 could see WIF surge to a maximum value of $0.70. On average, the WIF token could trade for around $0.31. Its minimum price is expected to be about $0.11.
| Dogwifhat price prediction | Potential Low ($) | Average Price ($) | Potential High ($) |
| Dogwifhat price prediction 2026 | 0.11 | 0.31 | 0.70 |
Dogwifhat price prediction 2027-2032
| Year | Minimum Price ($) | Average Price ($) | Maximum Price ($) |
| 2027 | $0.17 | $0.63 | $1.50 |
| 2028 | $0.25 | $1.26 | $2.80 |
| 2029 | $0.17 | $0.84 | $2.00 |
| 2030 | $0.11 | $0.49 | $1.20 |
| 2031 | $0.21 | $0.98 | $2.50 |
| 2032 | $0.35 | $1.68 | $4.50 |
Dogwifhat price prediction 2027
The WIF price prediction for 2027 indicates a continued rise, with a minimum price of $0.17, a maximum price of $1.50, and an average price of $0.63.
Dogwifhat price prediction 2028
Dogwifhat price is expected to reach a minimum of $0.25 in 2028. The maximum expected WIF price is $1.26, with an average price of $1.89.
Dogwifhat price prediction 2029
The WIF price prediction for 2029 estimates a minimum price of $0.17, a maximum price of $2.00, and an average price of $0.84.
Dogwifhat price prediction 2030
The Dogwifhat price prediction for 2030 suggests a minimum price of $0.11 and an average price of $0.49. The maximum forecasted Dogwifhat price is set at $1.20.
Dogwifhat (WIF) price prediction 2031
The WIF price prediction for 2031 anticipates further upside, resulting in a maximum price of $2.50. Based on expert analysis, investors can expect an average price of $0.98 and a minimum price of about $0.21.
Dogwifhat price forecast 2032
According to the WIF price forecast for 2032, Dogwifhat is anticipated to trade at a minimum price of $0.35, a maximum price of $4.50, and an average trading price of $1.68.

Dogwifhat market price prediction: Analysts’ WIF price forecast
| Firm | 2026 | 2027 |
| Coincodex | $0.1484 | $0.4045 |
| Priceprediction.net | $0.6021 | $0.5306 |
Cryptopolitan’s Dogwifhat (WIF) price prediction
Cryptopolitan’s WIF price prediction proposes a bullish outlook for Dogwifhat’s future price should the market recover soon.
According to our analysis, if the bulls get back in, WIF could recover to about $0.3 by the end of 2026. By 2029, we expect continuous growth of the overall crypto market and a utility-based approach for WIF, which could see the token trade at an average price of $1.4 to $2.2.
Dogwifhat historic price sentiment
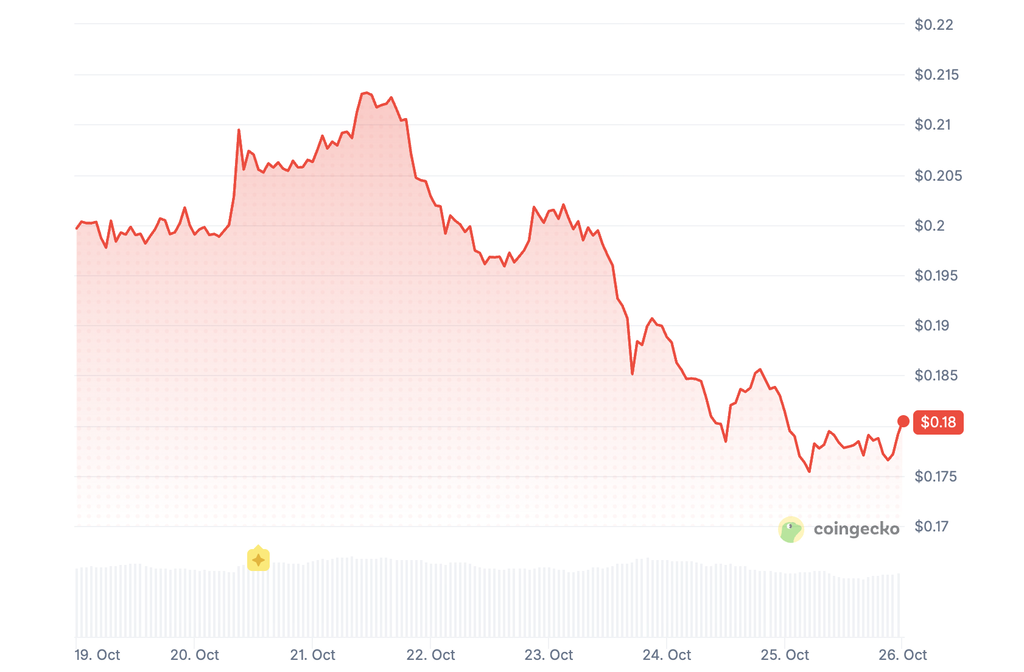
- WIF launched in November 2023 and traded mostly between $0.10 and $0.30 before gaining major traction in 2024.
- In 2024, WIF surged from about $0.15 in January to its all-time high of $4.85 by late March, then fell to $1.95 in April. It later traded between $2 and $4 for several months, reached $4.67 in November, and closed the year weaker near $1.86.
- In 2025, WIF continued declining, falling from $1.86 in January to around $0.42–$0.44 by March. It briefly recovered in April and May, reaching $1.38, but weakened again through the second half of the year, trading mostly below $1 and ending December between $0.2643 and $0.4491.
- In 2026, WIF stayed under pressure, trading between $0.2643 and $0.4959 in January, $0.176 and $0.287 in February, $0.1625 and $0.2006 in March, and around $0.177–$0.180 in April.
- In May 2026, WIF traded between approximately $0.179 and $0.235, with an average price near $0.205. In June, WIF traded within a range of roughly $0.13 to $0.20.
- In July, WIF traded as high as roughly $0.162 in late July before ending the month near $0.143.
- In August, WIF fell to a monthly low near $0.1338 before rebounding sharply to a high of about $0.2369, eventually closing the month near $0.1972. WIF opened September near $0.1971, dipped to $0.1744 and rallied to $0.2778 before closing at $0.2485, up 26.1%.
- WIF’s October decline has continued, with the token trading around $0.1796 as of October 25, down 11.1% from October 16 and 33.0% from its October 2 level of $0.2682.

The content on CoinReporter.io is for informational purposes only and is not financial or investment advice. Cryptocurrency investments are highly volatile and risky. Always conduct your own research and consult a qualified financial advisor before making any investment decisions. CoinReporter.io and its authors are not liable for any losses resulting from actions based on this website’s content.
Key takeaways:
- Bitcoin price faces volatility around $80K.
- Our Bitcoin price prediction expects BTC’s price to reach $150K by the end of 2026 due to the bullish sentiment following the halving event.
- By 2032, BTC might touch $350,548 following increased institutional adoption.
Bitcoin’s outlook for 2026 has become highly debated. The approval of spot Bitcoin ETFs and the rally after the halving were expected to bring more clarity, but instead they’ve brought mixed volatility in Bitcoin price forecast.
However, top analysts are bullish on BTC price prediction this year. Charles Hoskinson, the founder of Cardano, has predicted that Bitcoin could reach about $250,000 by 2026. He bases this view on Bitcoin’s limited supply and the possibility that institutions and major companies will continue to adopt it. Investor and author Robert Kiyosaki has made a similar prediction, arguing that Bitcoin’s scarcity makes it a strong store of value in a world where traditional currencies are becoming less stable.
As Bitcoin’s on-chain activities surge, questions arise, such as: “Does Bitcoin have the potential to hold above the $100K mark?” or “Will Bitcoin go up?” or “Where will Bitcoin be in 5 years?” Let’s answer them using our Bitcoin price prediction 2026 model.
Overview
| Cryptocurrency | Bitcoin |
| Ticker | BTC |
| Price | $77,314 (-0.5%) |
| Market capitalization | $1.42 Trillion |
| Trading volume (24-hour) | $52.53 Billion (+7%) |
| Circulating supply | 20 Million BTC |
| All-time high | $124,457; August 14, 2025 |
| All-time low | $0.04865; Jul 15, 2010 |
| 24-hour high | $78,585 |
| 24-hour low | $77,002 |
Bitcoin price prediction: Technical analysis
| Metric | Value |
| Current Price | $77,314 |
| Price Prediction | $ 83,907 (+1.16%) |
| Fear & Greed Index | 74 (Greed) |
| Sentiment | Bullish |
| Volatility | 3.80% (Medium) |
| Green Days | 15/30 (50%) |
| 50-Day SMA | $ 77,286 |
| 200-Day SMA | $ 71,295 |
| 14-Day RSI | 61.08 (Neutral) |
Bitcoin price analysis
TL;DR Breakdown:
- BTC price analysis shows that sellers are pushing the price toward $77K
- Resistance for BTC is at $79,164
- Support for BTC/USD is at $76,377
The BTC price analysis for 31 October confirms that BTC faces selling pressure as BTC declines toward $77K. Currently, the Bitcoin price is aiming to hold above $80K.
BTC price analysis 1-day chart: Bitcoin faces selling pressure toward $77K
Analyzing the daily Bitcoin price chart, we see that Bitcoin faces selling pressure as it declines toward $77K. Currently, the BTC price is facing long-liquidation around immediate resistance channels. The 24-hour volume has surged to $1.07 billion, showing a surge in trading interest today. BTC is trading at $77,314, declining by over 0.5% in the last 24 hours.
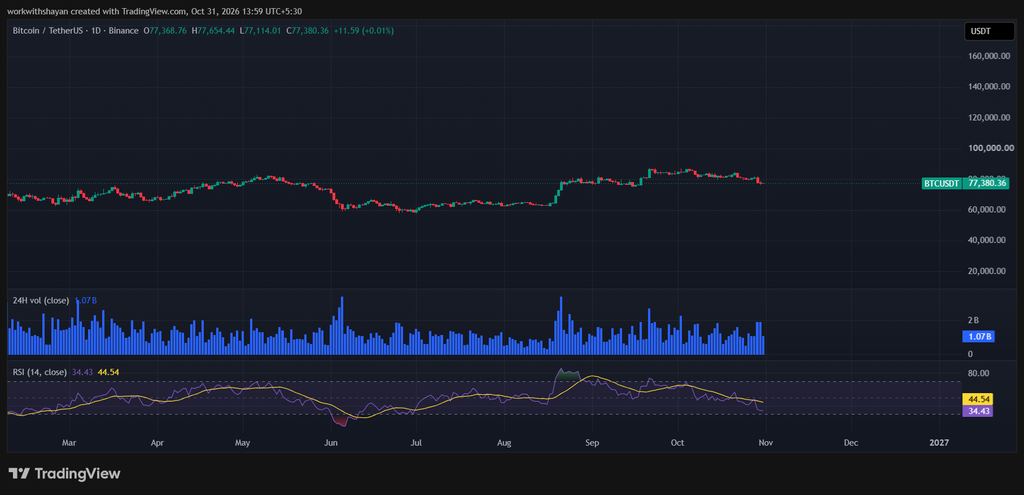
The RSI-14 trend line hovers around 34, hinting that a strong bearish pressure is on the way. The SMA-14 level suggests volatility in the next few hours.
BTC/USD 4-hour price chart: Selling domination rises around EMA trend lines
The 4-hour Bitcoin price chart suggests that sellers are strengthening their position to hold the price below the EMA trend lines. Currently, buyers are strongly defending a decline.
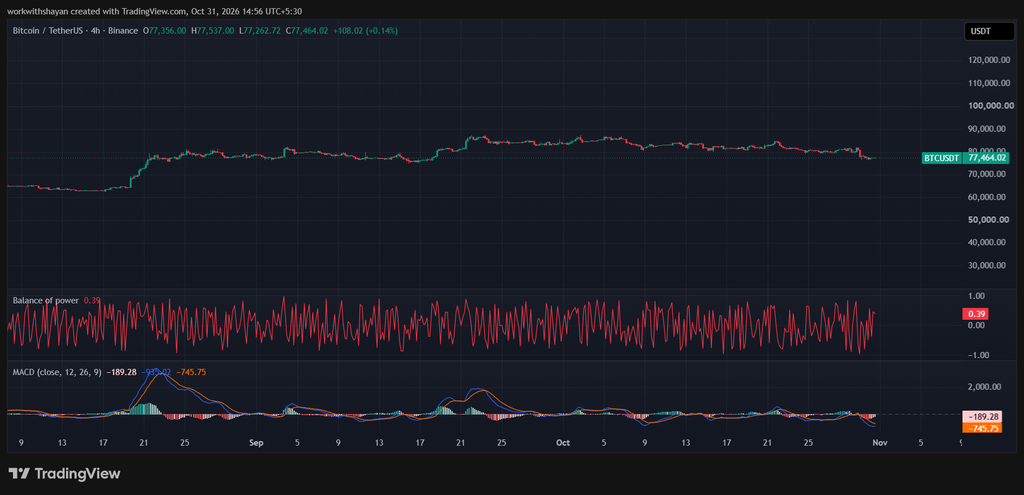
The BoP indicator trades in a buying region at 0.39, showing that buyers are taking a chance to accelerate an upward trend.
However, the MACD indicator has formed red candles below the signal line and the indicator aims for negative momentum, strengthening short-position holders’ confidence.
Bitcoin technical indicators: Levels and action
Daily simple moving average (SMA)
| Period | Value | Action |
| SMA 3 | $ 77,864 | SELL |
| SMA 5 | $ 77,911 | SELL |
| SMA 10 | $ 78,386 | SELL |
| SMA 21 | $ 72,700 | BUY |
| SMA 50 | $ 67,904 | BUY |
| SMA 100 | $ 66,272 | BUY |
| SMA 200 | $ 69,497 | BUY |
Daily exponential moving average (EMA)
| Period | Value | Action |
| EMA 3 | $ 77,871 | SELL |
| EMA 5 | $ 77,957 | SELL |
| EMA 10 | $ 77,123 | BUY |
| EMA 21 | $ 74,095 | BUY |
| EMA 50 | $ 69,992 | BUY |
| EMA 100 | $ 69,059 | BUY |
| EMA 200 | $ 73,004 | BUY |
What to expect from BTC price analysis next?
The hourly price chart confirms that Bitcoin is attempting to drop below the immediate support line; however, bulls are eyeing a recovery rally in the coming hours. If BTC’s price holds momentum above $79,164, it will fuel a bullish rally to $81,705.
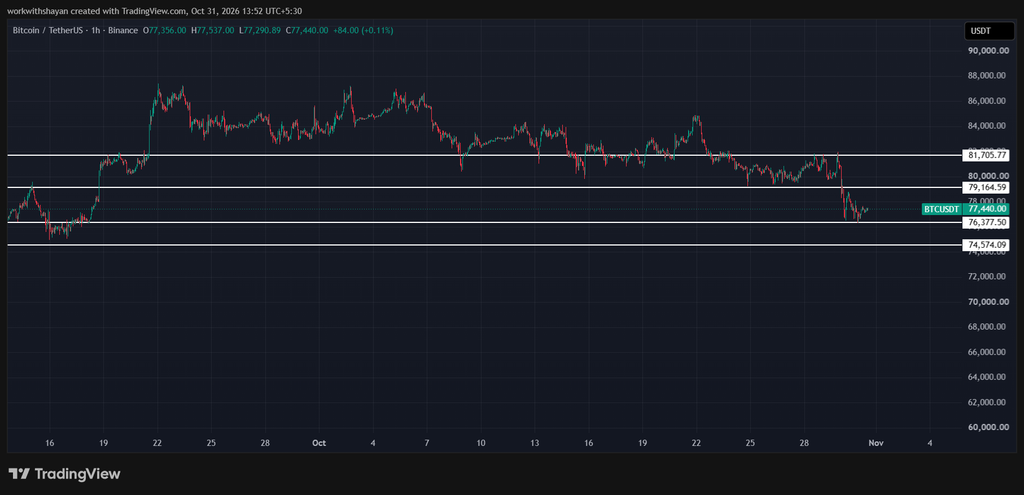
If bulls fail to initiate a surge, the BTC price may drop below the immediate support line at $76,377, beginning a bearish trend to $74,574.
Is Bitcoin a good investment?
The rising institutional demand for Bitcoin etfs makes it a good investment option in the crypto market. However, Bitcoin has a short investment history filled with very volatile market value. Whether it is a good investment depends on your financial profile, investment portfolio, risk tolerance, and investment goals. It is suggested to conduct investment advice of the financial markets and understand the financial system risks.
Why is Bitcoin down today?
Bitcoin faced a surge in selling pressure as sellers pushed the price toward immediate fib levels around $77K.
Will the BTC price reach $100K?
Bitcoin price broke its much-anticipated mark of $100K, aiming for a new ATH. The price currently prepares to maintain its buying demand above $100K.
Will BTC reach $1 million?
$1 million is a significant milestone for the BTC price. However, it is achievable if Bitcoin continues to attract institutional interest in the coming years.
Is Bitcoin a good long-term investment?
As several institutions continue to accumulate BTC and Bitcoin faces a rise in global recognition, Bitcoin has a solid long-term future.
Recent news/opinions on BTC
As reported by Cryptopolitan, a Glassnode report highlights Q3 as a possible bottom for Bitcoin, noting early accumulation, while Mudrex Learn suggests October 2026 to December 2026 as the most probable period, with a low of $50,000 to $55,000, according to Anupam Dodecha’s analysis.
Bitcoin price prediction October 2026
Bitcoin’s price surged toward $80K in September. It is now facing minor accumulation, which could mean we’ll see a recovery around October 2026.
Bitcoin’s price might attempt to maintain an average price of $75,000 and be pushed further, at least $90,000 if strong downward pressures are not seen. However, we might see a rejection on the bearish side, leading to a consolidation at around $70,000.
| Bitcoin Price Prediction | Potential Low | Potential Average | Potential High |
| Bitcoin Price Prediction October 2026 | $70,000 | $75,000 | $90,000 |
Bitcoin price prediction 2026
Historically, Bitcoin has been a significant crypto coin in the years following a halving, and it is expected to push up its price after a downturn in 2025. Bitcoin miners might play a crucial role in holding bullish sentiment for future price movements.
Spot Bitcoin ETFs are projected to be a key driver of Bitcoin prices and the broader cryptocurrency market in 2026. As a result, Bitcoin’s trajectory might follow a bullish trend ahead with rising treasury term premium.
Furthermore, there is an increasing bullish sentiment that the base interest rates could be cut in the US, and thus, help to further the upward movement of Bitcoin. An outcome of which the 2026 year could be positive for Bitcoin, with its crypto-price perhaps touching $150,000 at the highest and the low could be around $48,000.
| Bitcoin Price Prediction | Potential Low | Potential Average | Potential High |
| Bitcoin Price Prediction 2026 | $48,000 | $100,000 | $150,000 |
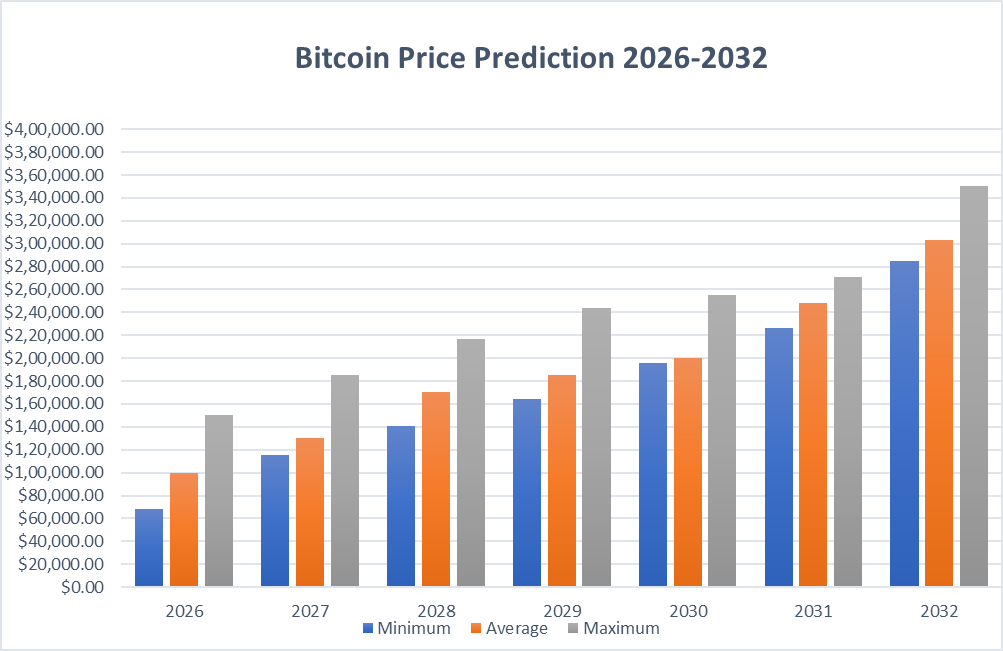
Bitcoin Price Predictions 2027-2032
| Year | Minimum Price | Average Price | Maximum Price |
| 2027 | $115,000 | $130,000 | $185,000 |
| 2028 | $140,491 | $170,100 | $216,738 |
| 2029 | $164,063 | $185,068 | $244,142 |
| 2030 | $195,629 | $200,312 | $255,321 |
| 2031 | $225,903 | $248,568 | $270,593 |
| 2032 | $285,058 | $303,555 | $350,548 |
Bitcoin price prediction 2027
Bitcoin might witness slow growth after 2025’s Bitcoin halving surge, resulting in a surge in selling pressure. However, more financial products including a surge in ETF flows might hold BTC prices within a bullish region. The digital assets market sentiment shows bullish signals for Bitcoin hit new highs. As the overall sentiment gives a bullish outlook, one should research more about Bitcoin before investing.
We might see a maximum price of $185,000, with a minimum price of $115,000 and average price of $130,000.
Bitcoin forecast 2028
Based on a detailed technical analysis of past Bitcoin price movements, it is projected that in 2028, Bitcoin could see a minimum price of $140,491. The potential maximum price is estimated to be $216,738, with an average closing price of $170,100.
Bitcoin price prediction 2029
By 2029, Bitcoin’s price is expected to reach a low of $164,063. Maximum price projections are as high as $244,142, averaging about $185,068 for the year.
Bitcoin price forecast 2030
Projections for 2030 suggest that Bitcoin could be valued at a minimum of $195,629. The price may peak at as much as $255,321, with an average throughout the year expected to be around $200,312.
Bitcoin (BTC) price prediction 2031
The forecast for 2031 suggests that Bitcoin’s price could start at a minimum of $225,903 and potentially rise to a maximum of $270,593. The average price is anticipated to stabilize at about $248,568 throughout the year.
Bitcoin price prediction 2032
The forecast for 2032 suggests that Bitcoin’s price could start at a minimum of $285,058 and potentially rise to a maximum of $350,548. The average price is anticipated to stabilize at about $303,555 throughout the year.
Bitcoin Market Price Prediction: Analysts’ BTC Price Forecast
| Firm Name | 2026 | 2027 |
| Gov.Capital | $102,000 | $96,000 |
| Kraken | $127,878 | $134,272 |
Cryptopolitan’s Bitcoin (BTC) Price Prediction
A surge in bitcoin adoption and the expansion of the Bitcoin ecosystem might end the controversy of “Bitcoin bubble” in future. This might boost the Bitcoin cost and strengthen the Bitcoin network. At Cryptopolitan, we are bullish on Bitcoin’s future price as the historical market sentiment is extremely impressive. By the end of 2026, Bitcoin might record a maximum of $150,000, with a minimum price of $48,000 and an average price of $100,000.
However, Bitcoin’s future market potential entirely depends on its buying demand, regulation, and investor sentiment regarding long-term holdings. Crypto analysts provide a positive sentiment as macroeconomic trends turn promising.
We expect Bitcoin price to surpass a high of $216,738 by the end of 2028.
Bitcoin historic price sentiment
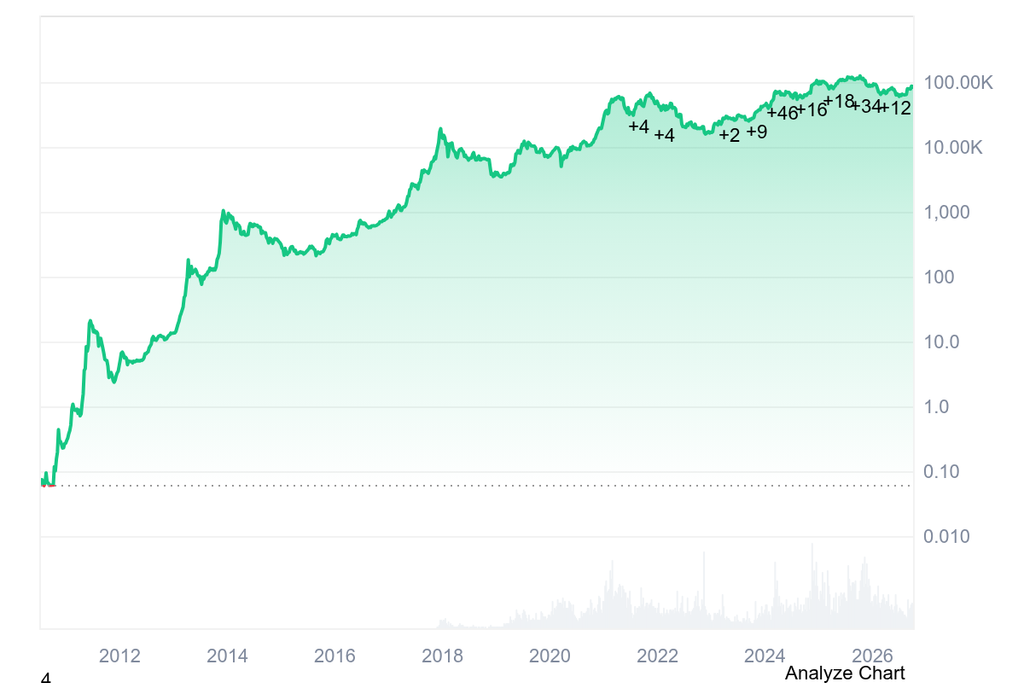
- Satoshi Nakamoto created Bitcoin in 2009, marking the first use of blockchain technology.
- Bitcoin was initially of little value, gaining significant traction and hitting over $15,000 during the 2017 boom, with further highs reached in 2019 and 2021.
- In 2021, Bitcoin peaked at $68,789.63 but dropped to $15,760 by December 2022 amid economic pressures, including inflation and geopolitical conflicts.
- By April 10, 2023, Bitcoin’s price surged 83%, breaking the $30,000 resistance level.
- Throughout mid-2023, Bitcoin’s value hovered around $30,000, nearly reaching $32,000 due to positive market sentiments and potential ETF approvals.
- Bitcoin experienced a significant price drop in mid-August 2023, falling to $25,000. However, its prices remained volatile, fluctuating between $26,000 and $29,500 in October.
- Bitcoin closed 2023 above $42,000, a 155% increase from the year’s start.
- In early 2024, Bitcoin rose above $45,000 on ETF anticipation but briefly dipped below $40,000 after approvals. It broke its 2021 all-time high in March, reaching $73,750.07 on March 14, before dropping below $60,000 in April. May saw another surge above $70,000, while June and July brought heavy fluctuations between $70K and $55K.
- Bitcoin rallied to $66K in September after a Fed rate cut, climbed to $70K in October’s Uptober rally, and surged toward $108K following Donald Trump’s victory in the November US elections. BTC ended 2024 consolidating below $95K.
- At the start of January 2025, BTC was trading between $92,788.13 and $95,824.39. However, it formed an ATH at $109,114 on January 20.
- In the weeks of February, the price of BTC dropped heavily as it dropped toward the $78K low.
- In March, the price of Bitcoin declined heavily and dropped toward a low of $76.6K. In April, the price of Bitcoin started recovering. By the end of April, it neared the critical $95K zone.
- In May, Bitcoin price skyrocketed and it formed a new ATH at $111,970. However, the price declined later, toward $104K.
- By the end of June, BTC price reclaimed the $108K level.
- In July, BTC price triggered a surge toward $123K; however, it faced strong selling pressure later.
- In mid-August, the price of Bitcoin surged above $124K. However, the price failed to maintain its momentum as it dropped below $110K in early-September.
- By the end of September, the price of Bitcoin dropped further and touched a low around $108K.
- In October, the price of Bitcoin crashed heavily below $110K. The price crashed further toward $84K in November.
- Bitcoin ended December 2025 on a bearish note by trading below $90K.
- Bitcoin price further dropped in January 2026 as it crashed toward $77K. In February, the price of BTC hit a low at $60K.
- BTC price continued to face bearish pressure in March. However, it surged above $70K in early April. By the end of April, BTC price surged toward $80K.
- By the end of May, the price of BTC dropped toward $73K. In June, BTC dropped toward $60K.
- In July, the price of BTC continued to hover around $60K. By the end of August, the price of BTC skyrocketed toward $80K. Bitcoin maintained a price above $80K in September.


Bitcoin Slides Below $78,000 as Risk-Off Sentiment Intensifies
Bitcoin fell below $78,000 on October 30, 2026, as confirmation of the Binance security incident accelerated a broader risk-off move...


Stablecoin Issuers and Partners Freeze Billions Linked to Binance Incident
Stablecoin issuers and blockchain partners moved rapidly to freeze billions of dollars in assets tied to the Binance security incident...


Binance Suffers Record $6.3 Billion Security Incident — Largest Crypto Heist in History
Binance, the world’s largest cryptocurrency exchange, confirmed a major security breach late on October 29, 2026, with an estimated impact...


LUNC Hits 462B Burned After v4.1.1 Upgrade
As of late October 2026, Terra Classic (LUNC) has burned approximately 462.5 billion tokens—about 6.7% of its roughly 6.445 trillion...


Hyperliquid Permanently Burns Nearly 5% of Maximum HYPE Supply Amid Broader Token Burn Trends
Hyperliquid has permanently burned 49.87 million HYPE tokens, representing 4.99% of the token’s 1 billion maximum supply and valued at...


Moody’s Assigns Investment-Grade A2 Rating to Ripple’s RLUSD; Coinbase Lists the Stablecoin
Moody’s Ratings assigned Ripple USD (RLUSD) an A2 long-term deposit rating and a P-1 short-term deposit rating on October 27,...


Google Cloud Unveils Multi-Party Computation Custody Service for Banks
Google Cloud introduced Google Multi-Party Compute (MPC), a dedicated institutional custody product for cryptocurrencies and tokenized assets, at its first...


Federal Reserve Holds Rates Steady as Bitcoin Trades Near $80,000; December Hike Odds Rise
The Federal Reserve left interest rates unchanged on October 28, 2026, holding the federal funds target range at 3.75% to...


Aviva Investors Tokenizes £22 Billion
LONDON — October 26, 2026 — Aviva Investors, the asset-management arm of UK insurer Aviva, launched a tokenized share class...


Ripple Secures Final OCC Approval for National Trust Bank to Oversee RLUSD
SAN FRANCISCO / WASHINGTON — October 26, 2026 — Ripple received final approval from the U.S. Office of the Comptroller...
-

 Crypto3 weeks ago
ESMA gives EU crypto firms three months to exit non-MiCA stablecoins
-

 Crypto4 weeks ago
Binance Burns 334.88 Million LUNC in October Fee Batch as Second Transaction Lifts the Day’s Total
-

 DeFi4 weeks ago
Hong Kong Moves Licensed Stablecoins Onto Exchanges and Into Fund Settlement
-

 Bitcoin3 weeks ago
Strategy (MicroStrategy) Adds 250 Bitcoin, Holdings Reach 848,250 BTC
-

 Bitcoin4 weeks ago
SEC clears listing path for first U.S. 3x Bitcoin and Ether ETFs
-

 DeFi4 weeks ago
TOKEN2049 Opens in Singapore Next Week as the City Leads Regional Crypto Flow
-

 DeFi4 weeks ago
HSBC Names Its Hong Kong Stablecoin RedCoin, and Starts With PayMe
-

 DeFi3 weeks ago
Bitcoin Drops Below $82,000 Amid $770M+ in Liquidations as Volatility Spikes
-

 DeFi1 month ago
Robinhood Puts Hedge-Fund Tools in the App as Macro Turns Softer
-
 Bitcoin3 weeks ago
Bitcoin breaks under $84,000 as oil spikes on Hormuz tanker attacks
-

 Bitcoin1 month ago
Strategy Adds Another 1,665 BTC, Lifting Holdings to 847,666
-

 DeFi4 weeks ago
South Korea Ranks Second in On-Chain Crypto Holdings as the Tax Date Holds
-

 Crypto4 weeks ago
Treasury and FinCEN drop unhosted-wallet and mixer surveillance proposals
-

 Bitcoin1 month ago
Coinbase Receives CFTC Approval for U.S. Derivatives Clearinghouse
-

 DeFi3 weeks ago
Government-linked wallets move seized coins
-

 Crypto4 weeks ago
Singapore Reclaims the Regional Crypto Lead at $284 Billion as the Rest of CSAO Shrinks
-

 DeFi4 weeks ago
BTSE Receives a Full Licence to Trade and Custody Crypto in Bhutan
-

 Bitcoin3 weeks ago
Spot bitcoin ETFs flip to a ~$487 million outflow
-

 DeFi3 weeks ago
Winklevoss files a 0.25% Zcash ETF
-

 DeFi3 weeks ago
Bitcoin Holds Above $84,000, Shrugging Off Heavy ETF Outflows as Oil Declines
-

 Bitcoin3 weeks ago
Bitcoin loses $84,000 as Hormuz attacks lift oil and yields
-

 DeFi2 weeks ago
U.S. Spot Bitcoin and Ethereum ETFs See Significant Weekly Outflows
-

 DeFi3 weeks ago
Uptober stalls ahead of the Fed minutes
-

 DeFi1 month ago
Quant Surges After Selection for U.S. Bank On-Chain Payments Initiative
-

 Crypto4 weeks ago
CFTC opens Regulation CTX and CAM after Clarity Act stalls
-

 Crypto3 weeks ago
Ether funds were already bleeding
-
 DeFi2 weeks ago
TRON Q3 2026 Report: $2.21 Trillion in Stablecoin Settlement Volume
-

 Bitcoin1 month ago
Spot Bitcoin ETFs Record Strongest Weekly Inflows of 2026, Flipping Year-to-Date Flows Positive
-
 DeFi2 weeks ago
Bitcoin and Ethereum Spot ETFs Record Substantial Weekly Outflows
-

 DeFi1 month ago
Bitget Puts $300 Million Protection Fund Back After Hack
-

 Bitcoin4 weeks ago
Bitcoin rejected again under $87,400 as Uptober stalls
-

 DeFi2 weeks ago
Arbitrum Rallies on Stablecoin Growth Program as DeFi Tokens Outperform
-

 Bitcoin3 weeks ago
Third rejection at $87,000 while stocks print records
-

 Crypto3 weeks ago
Treasuries, triple leverage, a testnet fork, and a bank app
-

 DeFi1 month ago
Bitget Raises Breach Estimate to $387.5 Million; Phased Withdrawals Begin September 28
-

 DeFi1 week ago
BNB Standard Corporation