Crypto
Arbitrum price prediction 2026-2032: Will ARB reach $1?

Key takeaways:
- Our ARB predictions anticipate a high of $0.21 in 2026.
- In 2028, the range is expected to be between $0.61 and $0.74, with an average price of $0.63.
- In 2030, it will range between $1.24 and $1.52, with an average price of $1.28.
Arbitrum price prediction points to a modest near-term outlook and a stronger long-term move: our ARB forecast sees a high of $0.21 in 2026, with the token potentially reaching between $1.24 and $1.52 by 2030 and averaging $1.28, which suggests it could reclaim and move past $1 by the end of the decade.
Layer 2s have generated considerable buzz for their efficiency, and the Arbitrum network is in the top 5 pack, with a total value locked (TVL) of $1.4 billion. Arbitrum is an Optimistic Rollup solution that shifts network operations off the Ethereum mainnet while maintaining Ethereum-level security, keeping ARB relevant to investors tracking Ethereum scaling adoption and long-term token demand.
For crypto investors, traders, and enthusiasts weighing ARB’s upside, this analysis examines Arbitrum’s current price action, technical indicators, market trends, competition, historical sentiment, recent news, and the key factors shaping its forecasts from 2026 to 2032. Is Arbitrum a good investment? Will it go up? Where will it be in 5 years? Let’s answer those questions with a data-driven Arbitrum price prediction to help you make more informed decisions in a volatile market.
Overview
| Cryptocurrency | Arbitrum |
| Ticker | ARB |
| Market cap | $0.1913 |
| Trading volume | $179.87M |
| Circulating supply | 6.89B |
| All-time high | $2.40 on Jan 12, 2024 |
| All-time low | $0.07067 on Jun 26, 2026 |
| 24-hour high | $0.2019 |
| 24-hour low | $0.1879 |
Arbitrum price prediction: Technical analysis
| Metric | Value |
| Volatility (30-day variation) | 8.71% (High) |
| 50-day SMA | $0.1739 |
| 200-day SMA | $0.1162 |
| Sentiment | Bullish |
| Green days | 18/30 (60%) |
| Fear and Greed Index | 63 (Greed) |
Arbitrum price analysis
On October 17, Arbitrum’s price fell 1.92% over 24 hours but was up 14.51% over 30 days. The 24-hour run was accompanied by falling trade volumes (-9.18%).
Broader crypto market conditions, strength across Ethereum Layer 2 networks, and ETH prices shape short-term sentiment. Rising TVL has also weighed on ARB sentiment as the market shifts.
ARB 1-day chart analysis
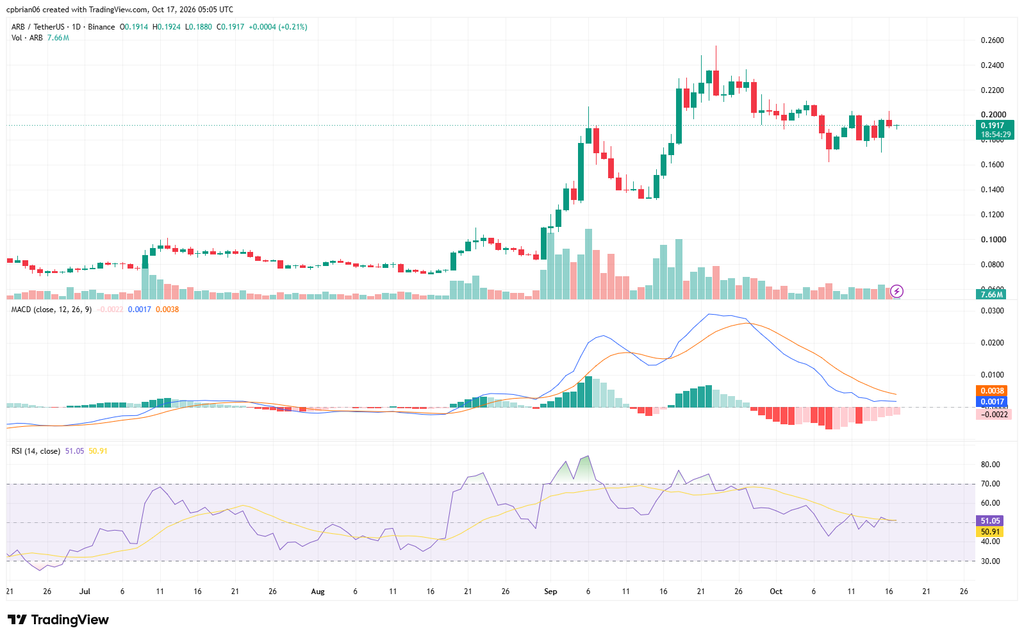
ARB trades sideways, reflecting a short-term neutral trend. The run tracked the broader altcoin rally. The move came after ARB recovered from $0.15 support levels. ARB now faces resistance at $0.23, with nearby support levels below the current range.
Arbitrum price 4-hour chart analysis
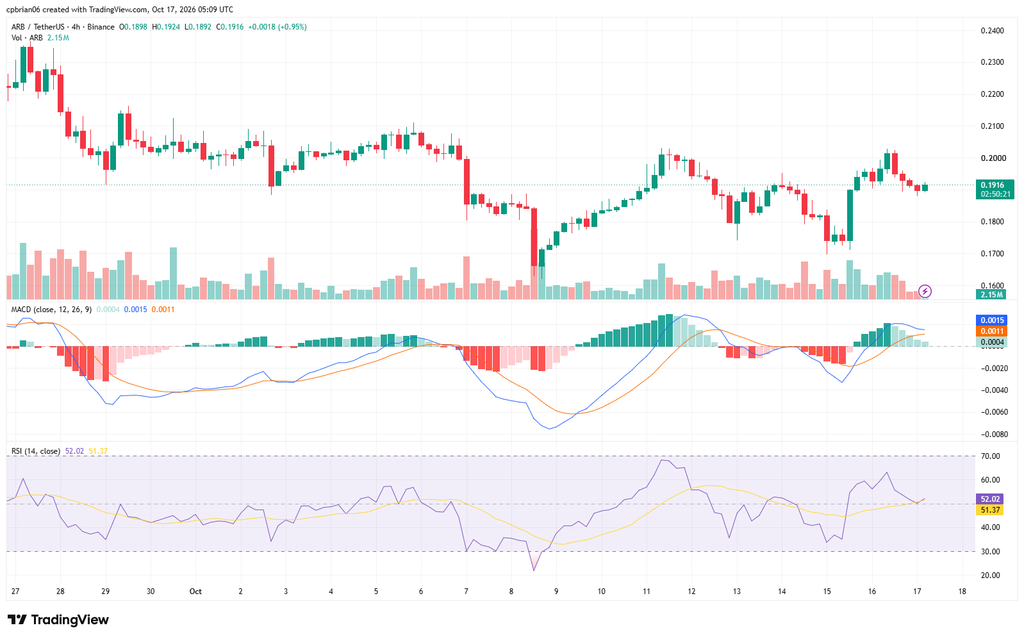
The chart highlights ARB’s correction and breakout from $0.15 support. Its Relative Strength Index is now at 52.02, in neutral territory. Over the short term, ARB is moving sideways at the 21-day SMA.
Arbitrum technical indicators: Levels and action
Daily simple moving average (SMA)
| Period | Value ($) | Action |
| SMA 3 | 0.1890 | BUY |
| SMA 5 | 0.1893 | BUY |
| SMA 10 | 0.1877 | BUY |
| SMA 21 | 0.1984 | SELL |
| SMA 50 | 0.1739 | BUY |
| SMA 100 | 0.1290 | BUY |
| SMA 200 | 0.1162 | BUY |
Daily exponential moving average (EMA)
| Period | Value ($) | Action |
| EMA 3 | 0.1899 | BUY |
| EMA 5 | 0.1891 | BUY |
| EMA 10 | 0.1903 | BUY |
| EMA 21 | 0.1911 | BUY |
| EMA 50 | 0.1729 | BUY |
| EMA 100 | 0.1480 | BUY |
| EMA 200 | 0.1456 | BUY |
What to expect from the ARB price analysis next?
Arbitrum’s near-term outlook is neutral; shorter timeframes also support a consolidation before the next leg up or down.
Why is Arbitrum down?
Arbitrum maintained a bullish stance over the last 30 days. Its recent correction was a result of a market-wide pullback and possible after-market effects of the October 16 token unlock.
Does Arbitrum have a future?
As a Layer-2 scaling solution for the Ethereum network, Arbitrum uses optimistic rollups to process transactions off-chain and submit proofs back to Ethereum, helping improve Ethereum’s scalability. Future ARB value depends on maintaining developer adoption and user activity. Network adoption and total value locked directly affect Arbitrum’s utility.
Ongoing token release schedules pose a continuous dilution risk to the asset. It also faces intense competition from other Ethereum Layer-2s like Optimism and zkSync; Optimism is pushing a Superchain strategy, while zkSync and StarkNet offer faster finalization than Arbitrum. Future performance also depends on whether governance activity improves value capture relative to network activity, but governance token ARB does not directly capture network transaction volume, which is why uncertainty around ARB’s value capture remains a significant concern among analysts. Institutional adoption could improve Arbitrum’s long-term growth prospects.
Recent news
Arbitrum’s Security Council has temporarily paused new Stylus contract activations on Arbitrum One and Arbitrum Nova in an emergency action on October 2, a security measure against hand-crafted WebAssembly programs that could threaten chain liveness.
ARB price prediction October 2026
The Arbitrum price forecast for October is estimated to range from $0.0750 to $0.1001, and this monthly outlook is one of several short-term price predictions investors may track. The average price for the month will be $0.0809.
| Month | Potential low ($) | Potential average ($) | Potential high ($) |
| October | 0.0750 | 0.0809 | 0.1001 |
Arbitrum price prediction 2026
For 2026, ARB’s price will range from $0.06 to $0.21. The average price for the period will be $0.21. Some forecasts put the predicted price at $0.50 by the end of 2026. Other late-2026 projections place Arbitrum between $0.09 and $0.17. Other market analysis projects 2026 between $0.08574 and $0.251, with an average of $0.1683.
| Year | Potential low ($) | Potential average ($) | Potential high ($) |
| 2026 | 0.0608 | 0.1822 | 0.2109 |
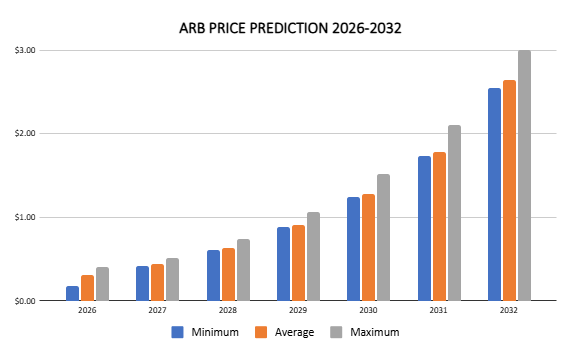
Arbitrum price prediction 2027-2032
| Year | Potential low ($) | Potential average ($) | Potential high ($) |
| 2027 | 0.2207 | 0.3364 | 0.5134 |
| 2028 | 0.6123 | 0.6341 | 0.7447 |
| 2029 | 0.8807 | 0.9124 | 1.06 |
| 2030 | 1.24 | 1.28 | 1.52 |
| 2031 | 1.73 | 1.78 | 2.10 |
| 2032 | 2.55 | 2.64 | 3.00 |
These forecasts are heavily influenced by market trends and broader market cycles. A strong crypto market can provide a tailwind, while macro and crypto market conditions significantly affect ARB’s valuation.
Arbitrum price prediction 2027
Arbitrum market price prediction climbs even higher into 2027. Some external forecasts place ARB’s price in a much more bullish $5.00 to $8.00 range across 2027-2028. Some crypto analysts place 2027 in a wider comparative range of $0.157 to $0.446, with an average near $0.3015. According to Arbitrum’s price forecast, ARB’s price will range from $0.22 to $0.51, with an average of $0.34.
Arbitrum coin price prediction 2028
Our analysis indicates a further acceleration in ARB’s price. It will trade between $0.61 and $0.74 and an average price of $0.63.
Arbitrum price prediction 2029
According to the 2029 Arbitrum forecast, ARB’s price will range from $0.88 to $1.06, with an average of $0.91.
ARB price prediction 2030
The ARB price prediction for 2030 is $1.24-$1.51, with an average of $1.28. Broader 2030 projections place ARB between $2.46 and $5.78, with an average of $4.12. In a bullish scenario, some forecasts extend toward $12.00, though the long-term impact depends on several factors, including on-chain metrics, market conditions, Layer-2 adoption, Ethereum scaling upgrades, TVL, and competition.
Arbitrum price prediction 2031
The Arbitrum price forecast for 2031 is a high of $2.10. It will reach a minimum price of $1.73 and an average price of $1.78.
Arbitrum ARB price prediction 2032
The year 2032 will also be bullish. Our analysis estimates a price range of $2.55 to $3.00, with an average price of $2.64. A conservative model suggests ARB could be around $0.13 by 2036 and $0.26 by 2051.
ARB market price prediction: Analysts’ ARB price forecast
This table compares analysts’ market analyses of Arbitrum’s price across leading platforms and serves as a simple price-prediction tool for reviewing external analysts’ forecasts. As a basic benchmark alongside these market indicators, a simple growth-based model would put ARB at around $0.25 over five years, assuming 5% annual growth.
| Platform | 2026 | 2027 | 2028 |
| Coincodex | $0.1590 | $0.2767 | $0.2870 |
| Gate.com | $0.2015 | $0.2317 | $0.2641 |
Cryptopolitan’s ARB price prediction
Cryptopolitan’s Arbitrum price forecast indicates that ARB will reach a high of $0.21 in 2026, and whether it’s a good buy depends on your risk tolerance and time horizon. At its current price below $1, ARB would need a 1000% surge to reach $10. Any path faces potential short-term constraints from supply growth, large token unlocks that can create downward price momentum, and market sentiment, so it would likely take several years even in favorable conditions.
Scheduled vesting schedules can introduce sell pressure, so valuation metrics should account for supply pressure from unlocks when making investment decisions. Since its launch, ARB has peaked at $2.40, so a $10 target at the current price level seems highly implausible.
In 2028, the range is expected to be between $0.61 and $0.74, with an average of $0.63. In 2030, the range is likely to be between $1.24 and $1.52, with an average of $1.28. ARB can be treated as a high-risk asset and should make up only a small percentage of a diversified portfolio, as macroeconomic trends shape risk appetite for digital assets, including Arbitrum.
This analysis is for informational purposes only, not investment advice; do your own research before making investment decisions and invest at your own risk in this highly volatile market, keeping the risks in mind.
Arbitrum historic price sentiment
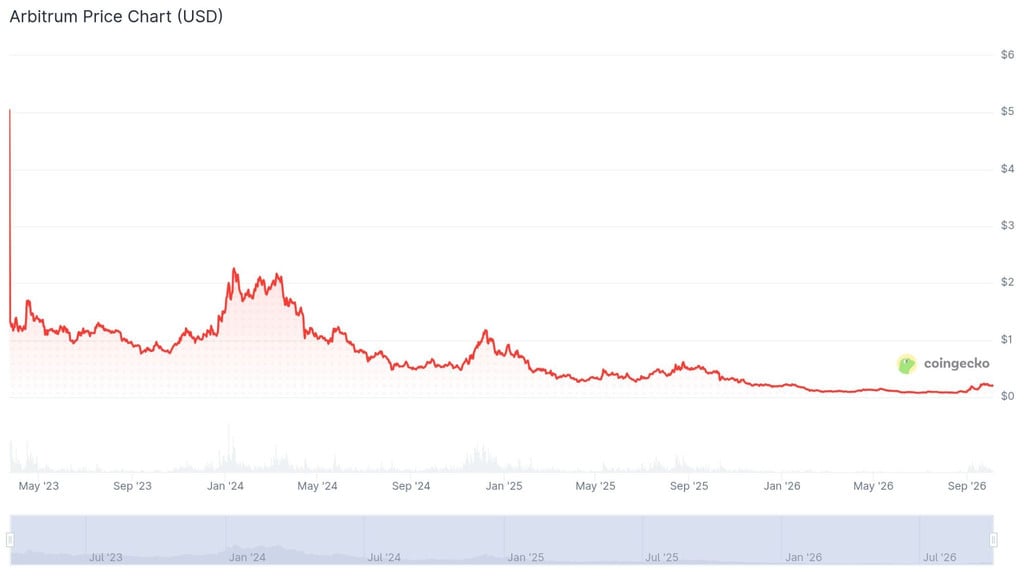
- The Arbitrum airdrop snapshot occurred on Feb 6, 2023, and eligible participants, including early users, started claiming ARB tokens on Mar 23, 2023. The claiming period ended on September 24, 2023.
- The airdrop granted 11.5% of the total supply to eligible users, 1.1% to DAOs operating in the Arbitrum ecosystem, and 44% to employees and Offchain Labs investors. The 44% is subject to lock-up periods and a vesting schedule, while whales control 57.13% of the supply, which can influence price movements when large holders reposition. The rest was sent to the Arbitrum DAO treasury.
- ARB is the native token of the network, with a total supply capped at 10 billion, annual inflation of 2%, and 12.75% of the supply initially distributed to eligible users and DAOs. ARB holders use it as a governance token to vote on protocol upgrades rather than to pay gas.
- A significant share of supply remains locked, and scheduled token unlocks increase circulating supply and can pressure price if demand does not keep pace.
- On Sep 11, 2023, it fell to its all-time low at $0.7453.
- Bitcoin’s halving and the hype around crypto ETFs helped the coin recover from its October slump. By the end of the year, it had risen to $1.4.
- The run continued into 2024. On Jan 12, it reached its all-time high at $2.40.
- According to CoinMarketCap data, ARB fell below its listing price in June 2024.
- On August 5, 2024, it registered a new all-time low of $0.4317
- It then recovered in September, reaching a high of $0.67.
- The bullish run continued into November, reaching $1.12 in December.
- The coin entered 2025 trading at $0.72 before entering a bear run, falling to a low of $0.40 in February.
- It recovered later and crossed into October, trading at $0.45. The trend later reversed, and by date 11, it had fallen to $0.136.
- In December, it traded at $0.20.
- ARB then entered a bear market in 2026 and, on Mar 30, 2026, hit an all-time low of $0.08653.
- It later began to recover, and by May it had crossed above $0.12. The trend reversed in June, with the price trading at $0.08. It maintained the level into August.
- In September, ARB broke out to the upside, rising 16.8% over 24 hours to $0.13, then reaching a high of $0.19. In October, it rose above $0.2.

The content on CoinReporter.io is for informational purposes only and is not financial or investment advice. Cryptocurrency investments are highly volatile and risky. Always conduct your own research and consult a qualified financial advisor before making any investment decisions. CoinReporter.io and its authors are not liable for any losses resulting from actions based on this website’s content.
Key takeaways:
- Binance coin price prediction for 2026 indicates that the coin’s price could reach a maximum price of $1,160.
- The Binance coin price prediction for 2028 projects a maximum price of $1,960 and a minimum price of $1,693.
- By 2032, BNB’s price could surge to $4,140 with broader acceptance in mainstream finance.
After notable changes in its executive team, Binance has shown resilience and prospects for recovery. The departure of Changpeng Zhao, Binance’s CEO, who was also embroiled in legal challenges, initially caused a decline in the value of Binance coin (BNB). Despite this initial setback, the cryptocurrency has shown a positive trend. In September 2020, Binance introduced BNB Smart Chain, which was initially designed for trading and transferring tokens and runs parallel to Binance Chain and supports smart contracts and decentralized applications (dApps) within the BNB Chain ecosystem.
What’s next for BNB in the remainder of 2026 and beyond? What can be the future price movements? Let’s get into the BNB price prediction and technical analysis.
Overview
| Cryptocurrency | Binance coin |
| Token | BNB |
| Price | $721.47 (-1.14%) |
| Market Cap | $96.06B |
| Trading Volume (24-hour) | $1.22B |
| Circulating Supply | 133.15M BNB |
| All-time High | $1,369.99 Oct 13, 2025 |
| All-time Low | $0.09611, Aug 01, 2017 |
| 24-hour High | $735.10 |
| 24-hour Low | $718.12 |
Binance coin price prediction: Technical analysis
| Metric | Value |
| Price Prediction | $790.42 (9.55%) |
| Fear & Greed Index | 63 (Greed) |
| Market Sentiment | Bearish |
| Volatility | 2.60% |
| Green Days | 17/30 (57%) |
| 50-Day SMA | $744.37 |
| 200-Day SMA | $644.73 |
Binance coin price analysis
TL;DR Breakdown:
- BNB price analysis shows a mixed trend, with the price trending at $721.47.
- The altcoin lost 1.14% in its value over the past 24 hours.
- BNB faces resistance around $729.
As of October 17, 2026, Binance Coin is exhibiting a mixed trend as buyers attempt to regain momentum. Price analysis reveals that the altcoin is recovering after experiencing a strong correction yesterday, facing the nearest resistance around $721.47. BNB is currently trading at $721.47, down 1.14% over the last 24 hours. Today’s losses could diminish as buying pressure mounts, with 24-hour trading volume at $1.22B and total supply at 133.15M BNB.
BNB/USD price analysis on the daily timeframe
The one-day chart for Binance Coin (BNB) shows that buying interest is emerging following yesterday’s dip. Buyers may retest the $729 resistance again in the next few hours, with the price now hovering around the $721.47 mark. The recent recovery is relatively weak, which is evident from the latest minimal increase in price. However, the emergence of a new green candlestick on the chart clearly signifies the presence of bullish elements as buyers uplift the price levels.
The distance between the Bollinger Bands highlights the intensity of volatility. This distance is not too wide, leading to mild volatility. Moreover, the upper limit of the Bollinger Bands indicator, indicating resistance, has shifted to $800. On the other hand, its lower limit indicates a broken support, moving around $710.
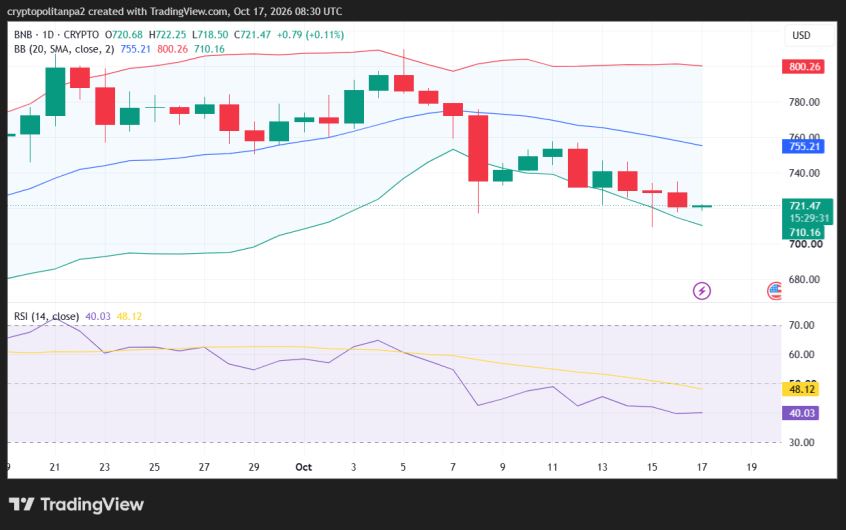
The Relative Strength Index (RSI) indicator is trending in the neutral region as it moves slightly upwards. The indicator’s value has increased to 40 in the past 24 hours. This situation indicates a positive market sentiment for BNB at the time of writing, as the bullish sentiment still exists at the current price level.
BNB price analysis on a 4-hour chart
The hourly candlestick charts analysis of Binance Coin shows negative sentiment for the altcoin. The BNB/USD pair corrected to $721.50 over the past few hours. However, the price is now trending above its simple moving average value.
The Bollinger Bands are converging, reflecting mild market volatility. The mild volatility signifies a lower chance of an upcoming reversal or further price decrease. Moving ahead, the upper Bollinger Band has shifted to $741, indicating resistance. Conversely, the lower Bollinger Band has moved to $712, marking a support level.
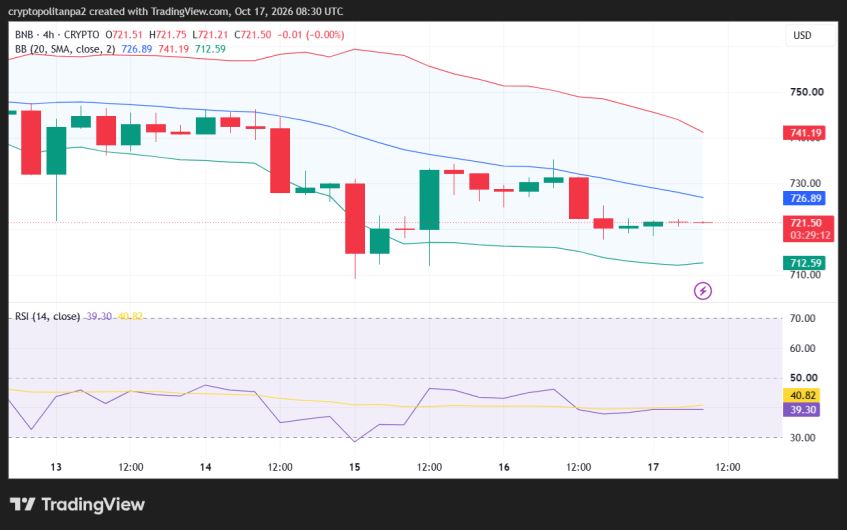
Multiple technical quantitative indicators are bearish but the RSI (Relative Strength Index) is trending in the neutral range. The indicator’s value decreased to 39 over the past few hours as the price moved downwards. The indicator’s descending curve suggests the presence of pressure from the selling side of the market, which is a discouraging sign for long-position holders.
BNB technical indicators: Levels and action
Daily simple moving average (SMA)
| Period | Value ($) | Action |
| SMA 3 | 733.03 | SELL |
| SMA 5 | 737.01 | SELL |
| SMA 10 | 746.43 | SELL |
| SMA 21 | 761.48 | SELL |
| SMA 50 | 744.37 | SELL |
| SMA 100 | 672.19 | BUY |
| SMA 200 | 644.73 | BUY |
Daily exponential moving average (EMA)
| Period | Value ($) | Action |
| EMA 3 | 732.05 | SELL |
| EMA 5 | 736.07 | SELL |
| EMA 10 | 744.82 | SELL |
| EMA 21 | 751.65 | SELL |
| EMA 50 | 733.69 | SELL |
| EMA 100 | 699.62 | BUY |
| EMA 200 | 695.03 | BUY |
What to expect from Binance coin price analysis?
Binance Coin candlestick charts analyses give a mixed prediction, as the current market sentiment is turning to be positive again following a continuous depreciation. At a price of $721.47, BNB still floats just below its highest price range of the month, with a minor partial recovery in price over the past few hours. If traders continue to buy, the BNB price may see a further increase and break above $720.
On the other hand, a failure in attracting buying demand might result in a correction. In such a case, the price of BNB might head toward the immediate support at $710.
Is BNB a good investment?
Considering the recent price moves, purchasing Binance coins and holding them for an extended period could yield significant returns. From a five-year plan standpoint, it is projected to see a large increase, possibly rising above $4,140 in 2032. However, financial choices shouldn’t be made exclusively based on our data.
Why is BNB down?
BNB found support at $718, and the price moved toward $721.47, as bulls are now targeting $729 once again. However, the cryptocurrency reports a 1.14% loss for the past 24 hours. If looked at from an overall view, the coin is now recovering again after losing some value at the time of writing.
Will BNB reach $1000?
The BNB price has already crossed $1000 in 2025, and buyers are holding it above $700. BNB can cross the $1000 again in 2026 anytime.
Will BNB reach $2000?
Currently, BNB is feeling pressure from legal challenges around its ecosystem. However, as these issues are settled by next year and on chain activity increases, the coin’s price is expected to start a bull run. As per the Binance coin price prediction, BNB will reach $2000 by the start of 2029.
Will BNB reach $4000?
Binance allows users to save up to 25% on spot margin trading fees by using BNB. Another factor is that users can save up to 10% on futures trading expenditures with the token, which makes the Binance platform a primary choice. Binance also uses a significant portion of its earnings to buy back BNB, which supports the Binance ecosystem. The burning process also decreases the token supply and increases demand, which is expected to increase in value above $4,140 by the end of 2032, which makes it a good option to buy BNB.
Does BNB have a good long-term future?
All cryptocurrencies involve risks and uncertainties. However, looking at the past price performance and the fact that BNB has a strong market position and a management team that runs the world’s largest cryptocurrency exchange. BNB has the potential for increased utility and is expected to retain a strong position in the cryptocurrency sphere. Binance coin price prediction and some fundamental factors suggest that holding it for the long haul is a good option, with tenfold expected returns in five years and the price reaching $4,140 by 2032. However, one must conduct his/her own research or seek professional financial advice before making investment decisions for digital assets.
Recent news/opinions on BNB
- BNB Chain has appointed Thomas Chen as Chief Business Officer to lead its institutional adoption, liquidity expansion, and on-chain growth strategy.
BNB price predictions for October 2026
According to expert analysis, Binance coin could reach a maximum price of $1,067 in October 2026. The average trading price is expected to be $750 for the month. The lowest BNB can go is $586, as per the current forecast.
| Period | Potential Low | Potential Average | Potential High |
| Binance coin price prediction October 2026 | $586 | $750 | $1,067 |
BNB price prediction 2026
According to the BNB forecast for 2026, it might reach a minimum price of $560. The maximum price can reach $1,160, with an average trading price of about $663.
| Period | Potential Low | Potential Average | Potential High |
| 2026 | $560 | $730 | $1,160 |
BNB price predictions 2027 – 2032
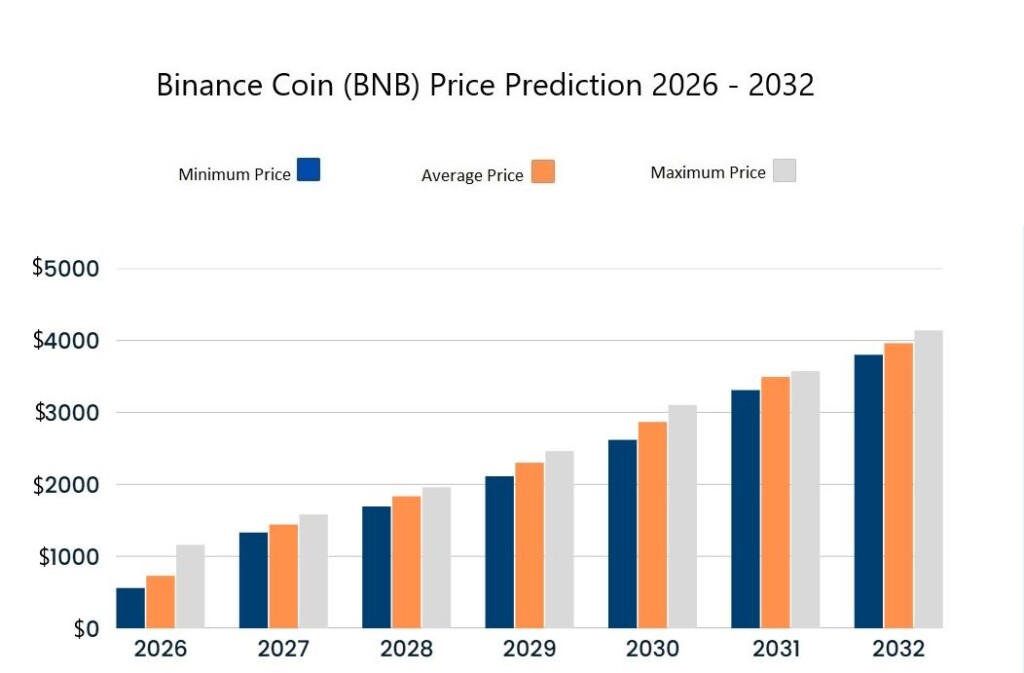
| Year | Minimum Price | Average Price | Maximum Price |
| 2027 | $1,331 | $1,442 | $1,583 |
| 2028 | $1,693 | $1,835 | $1,960 |
| 2029 | $2,113 | $2,301 | $2,463 |
| 2030 | $2,619 | $2,868 | $3,104 |
| 2031 | $3,310 | $3,493 | $3,573 |
| 2032 | $3,801 | $3,961 | $4,140 |
Binance coin price prediction 2027
Driven by strong technical factors, BNB could reach a maximum price of $1,583 in 2027, with an average of $1,442 and a minimum of $1,331.
Binance coin price prediction 2028
For 2028, the Binance Coin price forecast suggests that BNB could achieve a maximum valuation of $1,960, with an average trading price of $1,835 and a minimum of $1,693.
Binance coin price prediction 2029
In 2029, BNB is projected to have a maximum price of $2,463, an average price of $2,301, and a minimum value of $2,113.
Binance coin price prediction 2030
By 2030, BNB could reach a maximum predicted price of $3,104, with an average trading price of $2,868 and a minimum of $2,619.
Binance coin price prediction 2031
As per the Binance coin forecast, in 2031, BNB may attain a maximum valuation of $3,573, with an average closing price of $3,493 and a minimum of $3,310.
Binance coin price prediction 2032
The price of Binance Coin (BNB) could reach a maximum price of $4,140 in 2032, with an average value of $3,961 and a minimum of $3,801.
BNB market price prediction: Analysts’ BNB price forecast
| Firm Name | 2026 | 2027 |
| DigitalCoinPrice | $905.67 | $1,126.94 |
| CoinCodex | $933.55 | $2,144.97 |
Cryptopolitan’s BNB price prediction
Our forecast shows that Binance coin will achieve a high price of $1,160 by the end of 2026. In 2027, BNB’s price will range between $1,331 and $1,583. In 2032, it will range between $3,801 and $4,140, with an average of $3,961.
It is important to consider that the predictions are not investment advice. Professional consultation is suggested before investing in the volatile crypto market.
Binance Coin historic price sentiment
- Binance’s native token, BNB was launched in July 2017 through an Initial Coin Offering (ICO), with an initial price of around $0.10, according to historical crypto market data. As a utility token for the Binance cryptocurrency exchange started trading; it offered users reduced trading fees.
- In late 2017, BNB’s price significantly increased and reached its first major peak in January 2018, hitting approximately $24. However, it experienced a decline following the broader market correction.
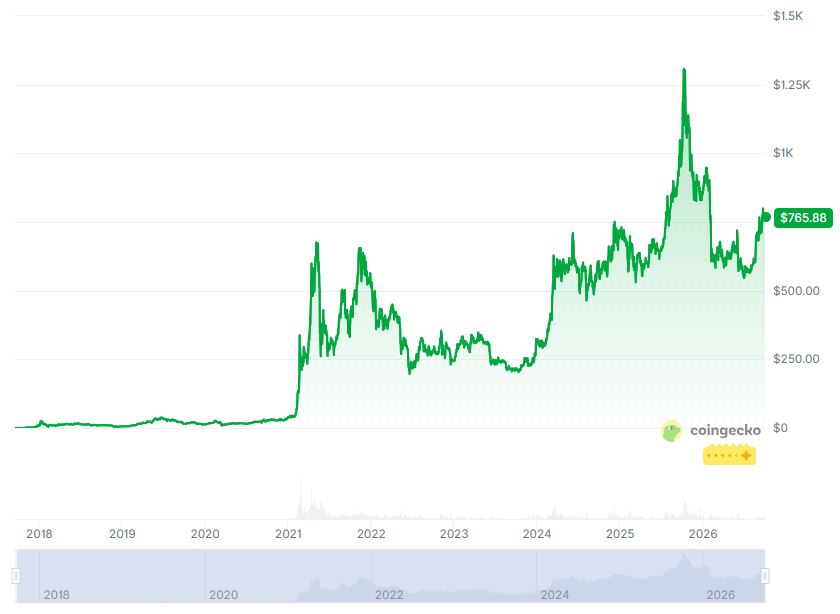
- Throughout 2018 and 2019, BNB’s price experienced gradual growth as the BNB market soared. In 2018, BNB traded near $13 for most of the year but dropped to $5 by December. However, BNB reached above $30 in June 2019, with broader growth in the crypto and stock market.
- Despite the global economic uncertainty caused by the COVID-19 pandemic, BNB maintained relative stability and saw an upward trend in 2020. Due to the growing popularity of Binance as an exchange and the expansion of its ecosystem, the coin touched the $34 range in November 2020.
- BNB experienced a significant bull run in early 2021, reaching a high of $600 in May 2021. Positive market sentiment helped improve its market capitalization, which remained at an all-time high until recently.
- Binance Coin’s price dynamics in 2022 were characterized by volatility and were influenced by a combination of macroeconomic factors and regulatory developments around the Binance exchange, which led to a bearish scenario. This took BNB to less than $220 in June and an average price of $250 in December.
- BNB remained a significant player in the cryptocurrency market in 2023, recovering to about $350 in April. However, it soon lost momentum, reaching about $205 in October. In late December, BNB climbed back to about $325.
- At the beginning of 2024, Binance Coin (BNB) traded near $300, surged to an all-time high of $717.48 in June, fluctuated between $488 and $661 through the year, and closed December at $700.3.
- In January 2025, BNB maintained an average price of $697, but it decreased to $589 by the end of February.
- BNB traded near the psychological mark of $600 in March and April 2025, and it reached above $650 in May, while it marked a new ATH of $858.34 on July 28.
- In August, BNB broke its own record and discovered several new all-time highs when BNB increased to $899.77 on August 22, showing significant growth.
- On September 21, BNB reached the $1,079.07 mark. In October, it hit a new all-time high (ATH) of $1,369.99 and is trading near the $1,100 mark in November.
- By the end of November, the price of BNB declined below $800. In early December, BNB price triggered a strong bull run toward $900.
- At the start of 2026, BNB was trending near the $870 level. However, it later declined toward
$620 in early March. - In April, the BNB price broke above $600, and it continued to hold steady above that level in May with some degree of bullish price action. However, BNB turned bearish in June, when the crypto market succumbed to heavy corrections.
- As per the latest data, the current BNB price is trending near $760 as October begins.
Don’t just read crypto news. Understand it. Subscribe to our newsletter. It’s free.


Inflation Shock Triggers Nearly $1 Billion in Liquidations as Bitcoin Tests $80,000
Hotter-than-expected U.S. inflation data rattled risk assets on October 15, 2026. September CPI rose 3.7% year-over-year, above the 3.6% forecast...


Bitcoin Drops Below $81,000 as Hotter U.S. CPI Revives Rate-Hike Fears and Asian Equities Tumble
Bitcoin fell sharply below $81,000 in early Asian trading on October 15, 2026, extending losses after a hotter-than-expected U.S. September...


U.S. Spot Bitcoin and Ethereum ETFs See Significant Weekly Outflows
U.S.-listed spot Bitcoin ETFs recorded roughly $681 million in net outflows over the trading week of October 5–9, 2026—the largest...


Binance Rolls Out AI Trading Interface Globally After 150,000-User Beta
Binance launched its free Binance AI personalized trading interface to all English-language users on October 12, 2026, following a beta...


Ethereum Foundation-Linked Wallets Transfer 4,393 ETH (~$11 Million) to Kraken
On October 12, 2026, two wallets historically linked to the Ethereum Foundation transferred a combined 4,393 ETH—valued at approximately $11.13...
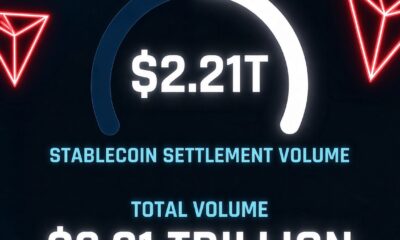

TRON Q3 2026 Report: $2.21 Trillion in Stablecoin Settlement Volume
TRON’s State of TRON Q3 2026 report, released in mid-October, highlighted $2.21 trillion (precisely $2.2126 trillion) in stablecoin settlement volume...


South Korea Blocks Domestic Access to 27 Unregistered Crypto Exchange Websites, Including KuCoin and MEXC
South Korea’s Financial Intelligence Unit (FIU), under the Financial Services Commission, announced on October 13, 2026, that domestic access would...


Bitcoin Drops Below $82,000 Amid $770M+ in Liquidations as Volatility Spikes
Bitcoin fell sharply on October 12, 2026, sliding below $82,000 and triggering more than $770 million in cryptocurrency liquidations, the...


Bitcoin Holds Above $84,000, Shrugging Off Heavy ETF Outflows as Oil Declines
Bitcoin rebounded to trade near or above $84,000 on Monday, October 12, 2026, recovering from earlier dips toward the low...


ESMA gives EU crypto firms three months to exit non-MiCA stablecoins
The European Securities and Markets Authority on 8 October told national supervisors that MiCA-authorised crypto firms should stop providing services...
-

 DeFi4 weeks ago
Bitcoin Reclaims $81,000 and Closes Above Key 50-Week Moving Average
-

 DeFi2 weeks ago
Hong Kong Moves Licensed Stablecoins Onto Exchanges and Into Fund Settlement
-
Crypto1 week ago
ESMA gives EU crypto firms three months to exit non-MiCA stablecoins
-

 Crypto2 weeks ago
Binance Burns 334.88 Million LUNC in October Fee Batch as Second Transaction Lifts the Day’s Total
-

 DeFi4 weeks ago
Coinbase Adds Fixed-Rate Bitcoin-Backed Loans via Morpho Midnight
-

 Bitcoin2 weeks ago
SEC clears listing path for first U.S. 3x Bitcoin and Ether ETFs
-
 DeFi2 weeks ago
Robinhood Puts Hedge-Fund Tools in the App as Macro Turns Softer
-

 DeFi2 weeks ago
TOKEN2049 Opens in Singapore Next Week as the City Leads Regional Crypto Flow
-

 DeFi1 month ago
Senate Rejects CLARITY Act Cloture in 49-50 Vote, Dealing Major Blow to U.S. Crypto Market Structure
-

 DeFi2 weeks ago
HSBC Names Its Hong Kong Stablecoin RedCoin, and Starts With PayMe
-

 DeFi3 weeks ago
Solana Advances Alpenglow Upgrade to Public Testnet
-

 Bitcoin3 weeks ago
Strategy Adds Another 1,665 BTC, Lifting Holdings to 847,666
-

 DeFi4 weeks ago
CFTC Submits Crypto Market Rules to White House Amid Congressional Stall
-

 DeFi2 weeks ago
South Korea Ranks Second in On-Chain Crypto Holdings as the Tax Date Holds
-
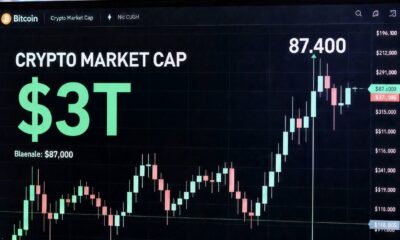
 DeFi4 weeks ago
Bitcoin Surges Above $87,000 as Crypto Market Cap Reclaims $3 Trillion
-
 Bitcoin2 weeks ago
Bitcoin breaks under $84,000 as oil spikes on Hormuz tanker attacks
-

 Bitcoin4 weeks ago
Record ETF Inflows and a Short Squeeze Drive Bitcoin’s $87,000 Break
-

 DeFi4 weeks ago
Bitcoin Surges Above $87,000 on ETF Inflows and Massive Short Squeeze
-

 Bitcoin3 weeks ago
Coinbase Receives CFTC Approval for U.S. Derivatives Clearinghouse
-

 Bitcoin4 weeks ago
X Partners With Coinbase, Kraken, Gemini and Brokers to Trade From the Timeline
-

 Crypto2 weeks ago
Treasury and FinCEN drop unhosted-wallet and mixer surveillance proposals
-
DeFi5 days ago
Bitcoin Drops Below $82,000 Amid $770M+ in Liquidations as Volatility Spikes
-

 DeFi2 weeks ago
BTSE Receives a Full Licence to Trade and Custody Crypto in Bhutan
-

 DeFi4 weeks ago
SEC Opens Pathway for Tokenized U.S. Equities After Legislative Setback
-

 Bitcoin4 weeks ago
Strategy Resumes Bitcoin Buying, Adds 950 BTC
-

 DeFi4 weeks ago
Circle Launches Arc Mainnet with Institutional Validators Including BlackRock and Visa
-

 DeFi1 week ago
Government-linked wallets move seized coins
-

 DeFi1 month ago
Crypto Market Suffers Broad Decline; Bitcoin Briefly Drops Below $75,000 Before Stabilizing
-
DeFi6 days ago
Bitcoin Holds Above $84,000, Shrugging Off Heavy ETF Outflows as Oil Declines
-

 DeFi4 weeks ago
Avalanche Gains on NYSE Tokenization Testing Reports
-

 Crypto2 weeks ago
Singapore Reclaims the Regional Crypto Lead at $284 Billion as the Rest of CSAO Shrinks
-

 Crypto2 weeks ago
CFTC opens Regulation CTX and CAM after Clarity Act stalls
-
 DeFi1 month ago
Federal Reserve
-

 Bitcoin4 weeks ago
Institutional Crypto Infrastructure Advances: Deutsche Bank Custody and Related Moves
-
 Bitcoin1 month ago
Bitcoin Spot ETFs Record $463 Million in Outflows
-

 DeFi1 month ago
Crypto Markets Slide as Clarity Failure, Rising Yields and Oil Prices Weigh; Bitcoin Briefly Tests Below $75,000