Crypto
Nearly $1 Billion in Crypto Liquidations as Volatility Spikes


Over $958 million wiped out in 24 hours as leveraged positions cascade amid rising market uncertainty
The cryptocurrency market experienced a sharp wave of liquidations on May 28-29, 2026, with more than $958 million in positions forcibly closed across over 167,000 traders in just 24 hours. The sudden surge in volatility caught many participants off guard, highlighting the persistent dangers of high-leverage trading in an uncertain macroeconomic environment.
Ethereum Takes the Hardest Hit
Ethereum led the liquidation charts, contributing approximately $246 million to the total. The second-largest cryptocurrency by market cap saw significant price swings, triggering a cascade of long positions as prices dipped rapidly.
Bitcoin also recorded substantial liquidations, though exact figures were lower than ETH. Altcoins across the board faced pressure, with smaller tokens experiencing even more severe percentage losses due to thinner liquidity.
Long positions accounted for the vast majority of the damage. Data from major tracking platforms showed that bullish bets were disproportionately wiped out, suggesting many traders had positioned for a continued rally that failed to materialize.
High Leverage Meets Macro Uncertainty
The liquidation storm was fueled by a classic combination of excessive leverage and external macro pressures. With many traders operating at 20x–100x leverage on perpetual futures contracts, even modest price moves of 2–4% were enough to trigger mass liquidations.
Analysts point to several contributing factors:
- Renewed uncertainty around U.S. interest rate policy and inflation data
- Geopolitical tensions impacting risk assets
- Profit-taking after recent market gains
- Coordinated deleveraging across centralized and decentralized exchanges
Hyperliquid, a popular decentralized perpetuals exchange, stood out with notable liquidation activity despite the broader market weakness. The platform has gained significant traction in 2026 for its high-speed execution and capital efficiency, but it was not immune to the volatility spike.
Market Reaction and Broader Implications
As of the latest data, total crypto market capitalization has pulled back from recent highs, with many assets entering short-term correction territory. The rapid flush of leveraged positions has, in some cases, created local buying opportunities as overextended longs were cleared out.
However, the event serves as a stark reminder of the risks inherent in crypto derivatives trading:
- Over 167,000 traders were affected in a single day
- Many retail participants likely lost entire account balances due to liquidation cascades
- Funding rates, which had been elevated, are now normalizing
Lessons for Traders
Market observers recommend several risk management practices in the current environment:
- Reduce leverage during periods of high macro uncertainty
- Use stop-losses and avoid over-concentration in single positions
- Maintain adequate margin buffers
- Monitor correlation between major assets like BTC and ETH
This latest liquidation event ranks among the larger single-day wipes in 2026, though it falls short of the record events seen in previous bull market blow-offs.
The bottom line: While volatility creates opportunities, it also ruthlessly punishes those who overstay their welcome with excessive leverage. As the market digests this flush, attention now turns to whether this represents a healthy reset or the start of a deeper correction.

The content on CoinReporter.io is for informational purposes only and is not financial or investment advice. Cryptocurrency investments are highly volatile and risky. Always conduct your own research and consult a qualified financial advisor before making any investment decisions. CoinReporter.io and its authors are not liable for any losses resulting from actions based on this website’s content.












Key takeaways:
- Our Aptos price prediction anticipates a high of $2.54 by the end of 2026.
- In 2028, it will range between $14.33 and $22.91, with an average price of $20.18.
- In 2030, it will range between $79.95 and $99.65, with an average price of $82.60.
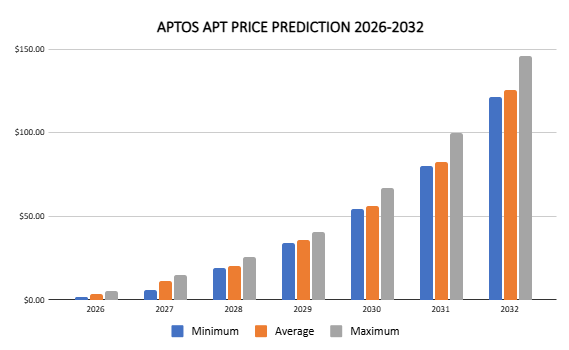
Our Aptos price prediction expects APT to reach a high of $2.54 by the end of 2026, exceed $10 in 2027, and potentially reach $100 by 2032, with an average price of $125 in 2032.
The Aptos blockchain has aggressively attracted capital to its ecosystem, with total value locked (TVL) exceeding $50 million, while Aptos remains a high-performance layer-1 blockchain with a mature decentralized finance (DeFi) ecosystem.
For crypto investors, traders, and enthusiasts weighing Aptos’s investment potential, this forecast breaks down Aptos’s price history, technical analysis, market sentiment, trading volume, and short- and long-term price predictions from 2026 to 2032 so you can judge where the token may fit in an evolving crypto market.
Aptos Network continues to build decentralized applications and tools for developers, and tracking APT’s outlook helps readers assess risk, spot market trends, and make better-informed investment decisions.
Overview
| Cryptocurrency | Aptos |
| Symbol | APT |
| Current price | $0.84 |
| Marketcap | $732M |
| Rank # | 79 |
| Circulating supply | 871M |
| Trading volume (24h) | $99M |
| 24-hour high | $0.88 |
| 24-hour low | $0.81 |
| All-time high | $19.90 on Jan 30, 2023 |
| All-time low | $0.5129 on Aug 31, 2026 |
Aptos price prediction: Technical analysis
| Metric | Value |
| Volatility (30-day variation) | 12.93% (Very high) |
| 50-day SMA | $0.6814 |
| 200-day SMA | $0.7506 |
| Current APT sentiment | Bullish |
| Green days | 17/30 (57%) |
| Fear and Greed Index | 64 (Greed) |
Aptos price analysis
At press time, Oct 11, Aptos had risen above $0.80, up 2.47% in 24 hours and up 31.66% in 30 days. Its trading volume fell by 24% over the last 24 hours, showing less conviction in the price trend.
Market sentiment and broader market conditions, such as interest rates, inflation, and wider macro liquidity conditions, can significantly influence Aptos price predictions, and those liquidity conditions often decide liquidity flows into altcoins like Aptos.
Aptos 1-day chart price
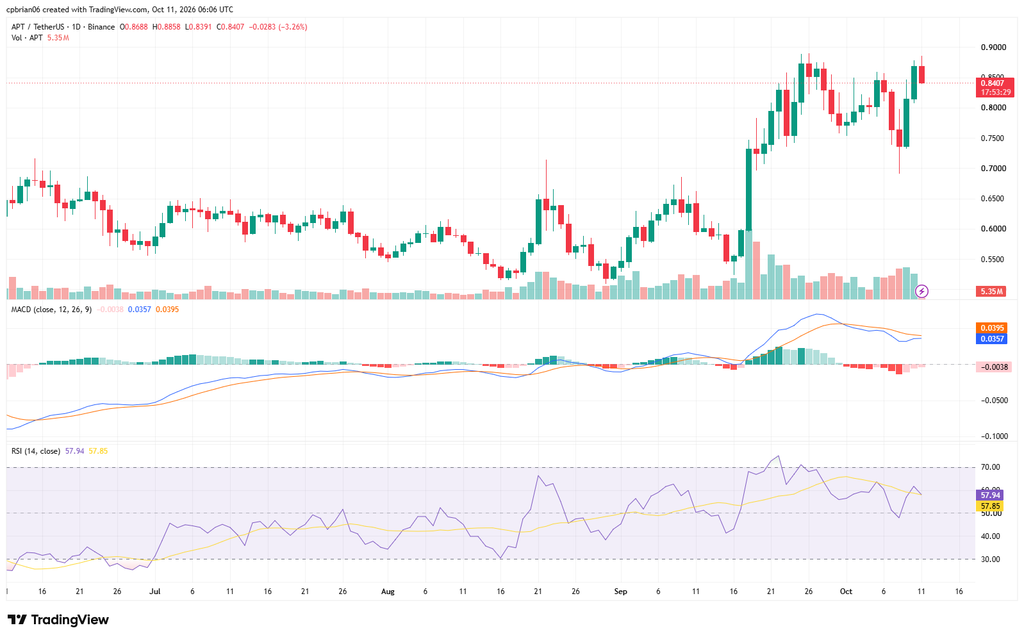
The MACD histograms show that APT’s negative momentum slowed, with recent price action declining before stabilizing. The move came as APT faced resistance at $0.87.
Its relative strength index (RSI) is neutral (57.94). RSI is an oscillator, a technical analysis tool that constructs upper and lower bands based on two extreme values (30 and 70). It is overbought above 70 and oversold below 30.
Aptos 4-hour chart price analysis
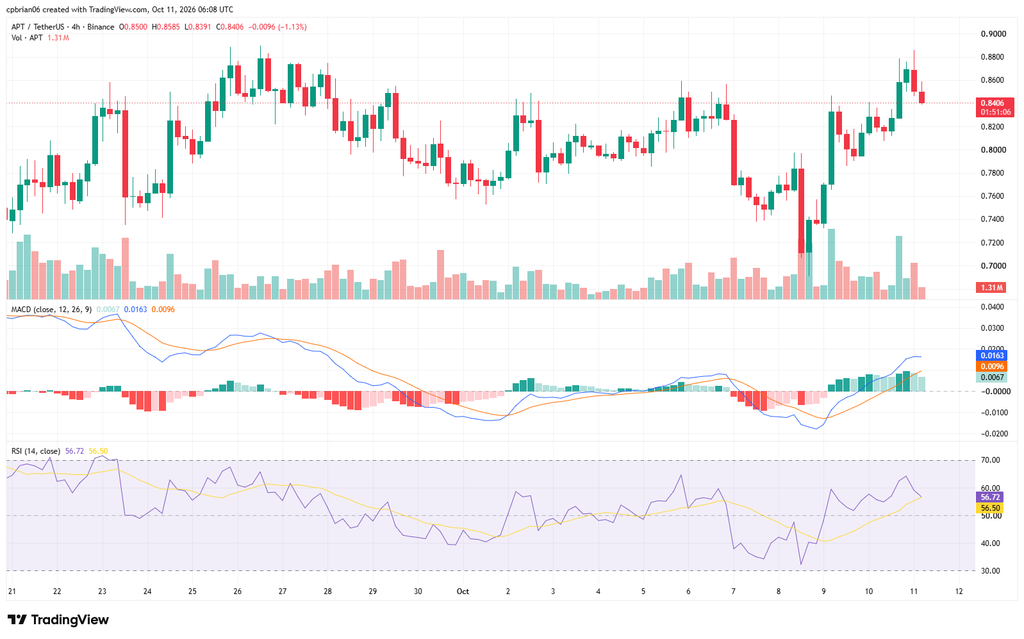
The chart highlights APT’s run this month. The latest candle formation suggests a correcting market. Its momentum dropped, with support and resistance levels at $0.77 and $0.87, respectively.
Aptos technical indicators: Levels and action
Daily simple moving average
| Period | Value ($) | Action |
| SMA 3 | 0.7732 | BUY |
| SMA 5 | 0.7980 | BUY |
| SMA 10 | 0.7934 | BUY |
| SMA 21 | 0.7990 | BUY |
| SMA 50 | 0.6814 | BUY |
| SMA 100 | 0.6365 | BUY |
| SMA 200 | 0.7506 | BUY |
Moving averages are a technical analysis tool used to identify trends and potential support or resistance levels. APT is trading above its 50-day and 200-day Simple Moving Averages, so those levels act as support.
Daily exponential moving average (EMA)
| Period | Value ($) | Action |
| EMA 3 | 0.7910 | BUY |
| EMA 5 | 0.7917 | BUY |
| EMA 10 | 0.7933 | BUY |
| EMA 21 | 0.7724 | BUY |
| EMA 50 | 0.7132 | BUY |
| EMA 100 | 0.7025 | BUY |
| EMA 200 | 0.9339 | SELL |
What to expect from the APT price analysis next?
According to the technical indicators, APT’s near-term price action remains weak. In the short term, the prediction suggests a correction. There is support at $0.77; if broken, it could send APT to $0.54.
Why is Aptos up?
APT’s rise is a combination of positive chart structure and speculation among traders.: The reaction at the $0.87 resistance level—a strong volume break above would signal conviction, while a rejection would suggest consolidation is needed.
Will Aptos reach $10?
Yes, Aptos will rise above $10 in 2027. The move will come as the market corrects to previous highs.
Will Aptos reach $100?
According to the Cryptopolitan price prediction, Aptos will reach $100 in 2032.
Will Aptos reach $1000?
According to Cryptopolitan’s price prediction, it remains unlikely that Aptos will reach $1,000 before 2032.
What is the long-term price prediction for Aptos?
According to Cryptopolitan price predictions, Aptos will trade higher in the years to come. However, factors such as market crashes or stringent regulations could undermine this bullish thesis, even though strong technological and scalability support the long-term case. Scaling beyond 100,000 transactions per second would also shape the long-term impact, while investment still carries risk if superior Layer 1 or Layer 2 solutions weaken Aptos’s market position.
How high can Aptos coin go?
According to Cryptopolitan’s price prediction, Aptos will reach a high of $126 in 2032.
Recent news- Aptos Foundation to lock 210M APT
The Aptos Foundation has committed to permanently locking and staking 210 million APT coins, removing the tokens from any future sale or distribution. This reduces the Foundation holdings, but the tokens will continue to exist and generate rewards, so it is not a burn either.
Aptos price prediction October 2026
The Aptos price forecast for October ranges from $0.58 to $0.91. The average price for the month will be $0.69.
| Month | Potential low ($) | Potential average ($) | Potential high ($) |
| October | 0.58 | 0.69 | 0.91 |
Aptos price prediction 2026
For 2026, APT’s price will range between $0.55 and $2.54. The average price for the period will be $1.92.
| Year | Potential low ($) | Potential average ($) | Potential high ($) |
| 2026 | 0.55 | 1.92 | 2.54 |
APT price prediction 2027–2032
| Year | Potential low ($) | Potential average ($) | Potential high ($) |
| 2027 | 3.59 | 9.18 | 11.84 |
| 2028 | 14.33 | 20.18 | 22.91 |
| 2029 | 34.08 | 35.59 | 40.67 |
| 2030 | 54.42 | 56.24 | 67.14 |
| 2031 | 79.95 | 82.60 | 99.65 |
| 2032 | 101.21 | 115.84 | 125.97 |
Aptos price prediction 2027
The Aptos APT price prediction estimates a range of $3.59 to $11.84, with an average price of $9.18. Other forecasts place 2027 in a much lower range of $0.6472 to $0.9467, with 2.42% upside at the upper target. Many platforms also place Aptos’s price forecast in a $10 to $30 trading range over the next two years.
Aptos price prediction 2028
Aptos coin price prediction climbs even higher into 2028. In a base case, APT’s trading price is expected to range from $14.33 to $25.91, while a more optimistic bull case could push it toward a higher peak ahead if momentum can confirm the trend; by contrast, bearish market expectations can keep 2027 targets in a much lower range, with an average of $20.18.
Aptos price prediction 2029
Our analysis indicates a further acceleration in APT’s price. It will trade between $34.08 and $40.67, with an average price of $35.59.
Aptos price prediction 2030
According to the Aptos forecast for 2030, the APT price is projected to range from $54.42 to $67.14, with an average of $56.24.
APT price prediction 2031
According to the Aptos price prediction for 2031, the price is expected to range between $79.95 and $99.65, with an average of $82.60.
Aptos price prediction 2032
The Aptos price prediction for 2032 is $145.97. It will reach a minimum price of $121.21 and an average price of $125.84. For readers asking how much Aptos will be worth farther out, some longer-range models predicted it could reach $1.04 by 2041.
APT market price prediction: Analysts’ APT price forecast
| Platform | 2026 | 2027 | 2028 |
| Coincodex | $0.6760 | $1.17 | $1.22 |
| Gate.com | $0.8456 | $0.8878 | $1.05 |
Cryptopolitan’s APT price prediction
Our predictions indicate that APT will reach a high of $2.54 by the end of 2026. In 2028, it will range between $14.33 and $22.91, with an average of $20.18. In 2031, it will range between $79.95 and $99.65, with an average price of $82.60.
Aptos price predictions are influenced by technological advancements, market sentiment, and institutional adoption. Future appreciation also depends on Total Value Locked, dApp ecosystem maturity, and demand.
Note that the content provided and other content are for general information purposes only and are not investment advice; they should not be treated as financial, fiscal advice, or other advice before making any investment decision. Seek independent professional consultation or do your research.
Aptos historic price sentiment
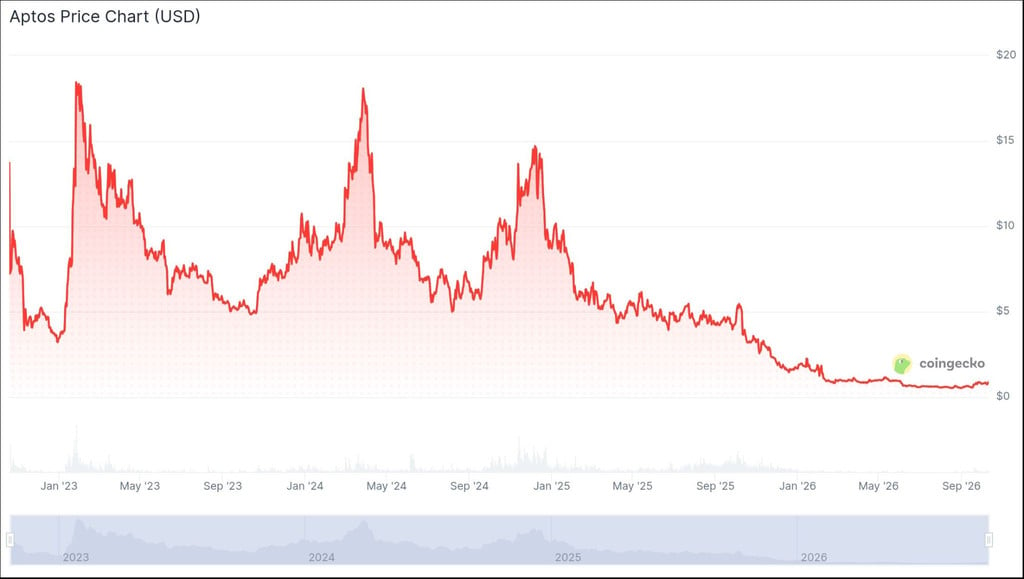
- Aptos raised seed funding in January 2022, led by a16z. Series A funding included Apollo, Dragonfly, Franklin Templeton, and others.
- Aptos traces its origins to the Diem project, which formed the foundation for the network’s early architecture and team.
- After launch, Aptos Labs and the Aptos Foundation became the core organizations supporting ecosystem development.
- The Aptos mainnet launched in October 2022 at Aptos genesis with an initial supply of 1 billion tokens and uses the Move programming language, which is optimized for blockchain applications.
- After the launch hype, Apt fell to its lowest in December 2022, at $3.09. A month later, the tables turned, as it peaked at $19.90 on January 30, 2023.
- It pumped, partly driven by the NFT market. Collections such as Aptos Monkeys and Aptomingod have attracted more users.
- On June 6, it fell below its initial listing price, extending losses from the preceding months.
- In October, it began correcting, rising to $8.47 in November.
- In 2024, it broke above $10, reaching $18 in March. From April, it reversed and fell below $10. By September, it had fallen to $6. It recovered in October, rising above $7.50. It crossed into November, trading at $8.9, and rose to $13.91. It corrected and traded at $13.24 into December.
- It was later corrected and crossed into 2025, trading at $8.71. The drop continued into February, and in May, it fell below $5.10.
- In October, it crossed above $5.30, then assumed a bear run, and by November, it had dropped to $3.21. In December, it reached a support level of $1.70. It maintained the levels into January 2026.
- Later, it turned bearish, falling below $1 in March and $0.90 in April. In May, it rose back above $1.00. In June, it had dropped to $0.65.
- The trend changed in September, as APT broke out to the upside and peaked at $0.88 in October.


ESMA gives EU crypto firms three months to exit non-MiCA stablecoins
The European Securities and Markets Authority on 8 October told national supervisors that MiCA-authorised crypto firms should stop providing services...


Uptober stalls ahead of the Fed minutes
Seasonality lost to bonds. October has been positive for bitcoin in 10 of the past 13 years, and 21Shares had...


Government-linked wallets move seized coins
Early on-chain reads put about $103 million in motion: 833.6 BTC, roughly $71.6 million, to Coinbase Prime, and 40,285 BNB,...


Winklevoss files a 0.25% Zcash ETF
Winklevoss Asset Services filed for a spot Zcash ETF, proposed Nasdaq ticker WINK, with Gemini as custodian and a 0.25%...


Spot bitcoin ETFs flip to a ~$487 million outflow
Tuesday’s US spot bitcoin ETFs took in about $119 million, the fourth inflow in five sessions. Wednesday reversed that. SoSoValue-linked...


Bitcoin loses $84,000 as Hormuz attacks lift oil and yields
Bitcoin closed at $83,275.93, down 2.67%, after Iran stepped up attacks on tankers in the Strait of Hormuz. Brent rose...


Binance Burns 334.88 Million LUNC in October Fee Batch as Second Transaction Lifts the Day’s Total
Binance removed 334,879,422 Terra Luna Classic (LUNC) from circulation on October 1, the headline transaction in its monthly exchange burn...


TOKEN2049 Opens in Singapore Next Week as the City Leads Regional Crypto Flow
TOKEN2049 runs October 7–8 at Marina Bay Sands. Organisers expect more than 25,000 people, from more than 7,000 companies and...


BTSE Receives a Full Licence to Trade and Custody Crypto in Bhutan
BTSE has a full financial-services licence in Gelephu Mindfulness City. The company said on September 29 that the Gelephu Financial...


South Korea Ranks Second in On-Chain Crypto Holdings as the Tax Date Holds
South Korea is second only to the United States in cryptocurrency that can be measured sitting in wallets and on...
-

 DeFi3 weeks ago
Bitcoin Reclaims $81,000 and Closes Above Key 50-Week Moving Average
-

 DeFi1 month ago
Solana Sets Record with Over 263,000 New Tokens Minted in a Single Day
-

 DeFi3 weeks ago
Coinbase Adds Fixed-Rate Bitcoin-Backed Loans via Morpho Midnight
-

 DeFi1 month ago
Visa Stablecoin Settlement Volume Hits $20 Billion Annualized Run Rate
-

 DeFi1 week ago
Hong Kong Moves Licensed Stablecoins Onto Exchanges and Into Fund Settlement
-
DeFi1 week ago
TOKEN2049 Opens in Singapore Next Week as the City Leads Regional Crypto Flow
-
Crypto2 days ago
ESMA gives EU crypto firms three months to exit non-MiCA stablecoins
-

 DeFi3 weeks ago
CFTC Submits Crypto Market Rules to White House Amid Congressional Stall
-

 DeFi4 weeks ago
Senate Rejects CLARITY Act Cloture in 49-50 Vote, Dealing Major Blow to U.S. Crypto Market Structure
-
 DeFi3 weeks ago
Bitcoin Surges Above $87,000 as Crypto Market Cap Reclaims $3 Trillion
-

 DeFi3 weeks ago
Bitcoin Surges Above $87,000 on ETF Inflows and Massive Short Squeeze
-

 Bitcoin3 weeks ago
X Partners With Coinbase, Kraken, Gemini and Brokers to Trade From the Timeline
-

 DeFi1 month ago
Bitmine Immersion Continues Aggressive ETH Accumulation
-

 Bitcoin3 weeks ago
Record ETF Inflows and a Short Squeeze Drive Bitcoin’s $87,000 Break
-

 Bitcoin1 month ago
Block (Jack Dorsey) Applies for U.S. Trust Bank Charter
-

 DeFi1 month ago
First U.S. Staked TRX ETF (Canary TRXS) Debuts
-

 DeFi4 weeks ago
Senate Republicans Release “Final” CLARITY Act Draft Ahead of September 15 Cloture Vote
-

 DeFi3 weeks ago
SEC Opens Pathway for Tokenized U.S. Equities After Legislative Setback
-

 Bitcoin3 weeks ago
Strategy Resumes Bitcoin Buying, Adds 950 BTC
-

 Bitcoin1 month ago
Crypto Market Faces Pressure as Bitcoin Tests Support Near $78K Amid Macro Headwinds
-

 DeFi3 weeks ago
Circle Launches Arc Mainnet with Institutional Validators Including BlackRock and Visa
-

 Bitcoin1 month ago
Liquid Network Exploit: 4,000 BTC Drained, 3,400 Returned in White-Hat Negotiation
-

 Bitcoin4 weeks ago
Metaplanet Reverses Course, Erasing ~$220 Million in Warrant Value
-

 Bitcoin2 weeks ago
Strategy Adds Another 1,665 BTC, Lifting Holdings to 847,666
-

 DeFi3 weeks ago
Federal Reserve
-
 DeFi1 week ago
Robinhood Puts Hedge-Fund Tools in the App as Macro Turns Softer
-

 Bitcoin2 weeks ago
Coinbase Receives CFTC Approval for U.S. Derivatives Clearinghouse
-
Crypto7 days ago
Binance Burns 334.88 Million LUNC in October Fee Batch as Second Transaction Lifts the Day’s Total
-

 DeFi1 month ago
Circle to Acquire Tazapay for $400 Million
-

 DeFi4 weeks ago
Crypto Markets Slide as Clarity Failure, Rising Yields and Oil Prices Weigh; Bitcoin Briefly Tests Below $75,000
-

 DeFi1 week ago
HSBC Names Its Hong Kong Stablecoin RedCoin, and Starts With PayMe
-

 Bitcoin3 weeks ago
Institutional Crypto Infrastructure Advances: Deutsche Bank Custody and Related Moves
-

 DeFi2 weeks ago
Solana Advances Alpenglow Upgrade to Public Testnet
-

 DeFi3 weeks ago
Avalanche Gains on NYSE Tokenization Testing Reports
-

 DeFi3 weeks ago
Crypto Market Suffers Broad Decline; Bitcoin Briefly Drops Below $75,000 Before Stabilizing
-

 Bitcoin4 weeks ago
Bitcoin Spot ETFs Record $463 Million in Outflows